- Cart 0
- English
Breaking Through CRC Immune Evasion Mechanisms: Nat Cell Biol. Reveals the "Immune Sequestration" Code of Tumor-Associated Adipose Tissue
April 14, 2026
Clicks:195
In the field of immunotherapy for colorectal cancer (CRC), the complex regulatory network of the tumor microenvironment (TME) has remained a central focus of research. A landmark study recently published in Nature Cell Biology has, for the first time, elucidated a novel mechanism of immune evasion driven by adipose-mesenchymal transformation in tumor-associated visceral adipose tissue (tVAT). Notably, Absin's 10% Normal Goat Serum (Catalog No.: abs933) played a pivotal supportive role in the critical experiments of this study. With its multiple robust product advantages, it established a solid experimental foundation for precise validation of the core mechanisms.
Article Title: Peritumoural adipose tissue drives immune evasion in colorectal cancer via adipose–mesenchymal transformation
Journal: Nat Cell Biol. (IF=19.1)
DOI:https://doi.org/ 10.1038/s41556-026-01885-0
Absin Product Used: Goat Serum (Cat. No.: abs933)

I. Research Strategy: Focusing on tVAT to Decode the "Blind Spot" of Immune Evasion in CRC
Previous studies have predominantly focused on the intratumoral microenvironment, while the abundant adipose tissue surrounding visceral tumors such as CRC has often been overlooked. The research team innovatively hypothesized that tVAT, as a critical component of the tumor microenvironment, might influence anti-tumor immune responses by competing with the tumor for immune cells.
The study design adopted a three-step strategy of "panoramic analysis – mechanistic validation – clinical translation":
- Utilizing single-cell RNA sequencing (scRNA-seq) and single-nucleus RNA sequencing (snRNA-seq) to construct comprehensive atlases of immune and stromal cells from tVAT, distal visceral adipose tissue (dVAT), and tumor tissues;
- Employing murine tumor models to validate the core mechanism of immune cell competition between tVAT and tumor, along with the critical signaling pathways involved;
- Integrating clinical patient data to explore the diagnostic value of tVAT-related indicators and targeted intervention strategies.
Throughout the experimental workflow, immunostaining served as the core technology for validating cellular localization and molecular expression, where the stability of experimental reagents directly determined data reliability. Absin abs933 10% Normal Goat Serum became the standard blocking reagent for immunofluorescence (IF) and multiplex immunohistochemistry (mIHC) assays in this study.
II. Core Research Findings: The Stunning Revelation of tVAT's "Immune Sequestration" Mechanism
1. tVAT as a "Hidden Niche" for Immune Cell Enrichment
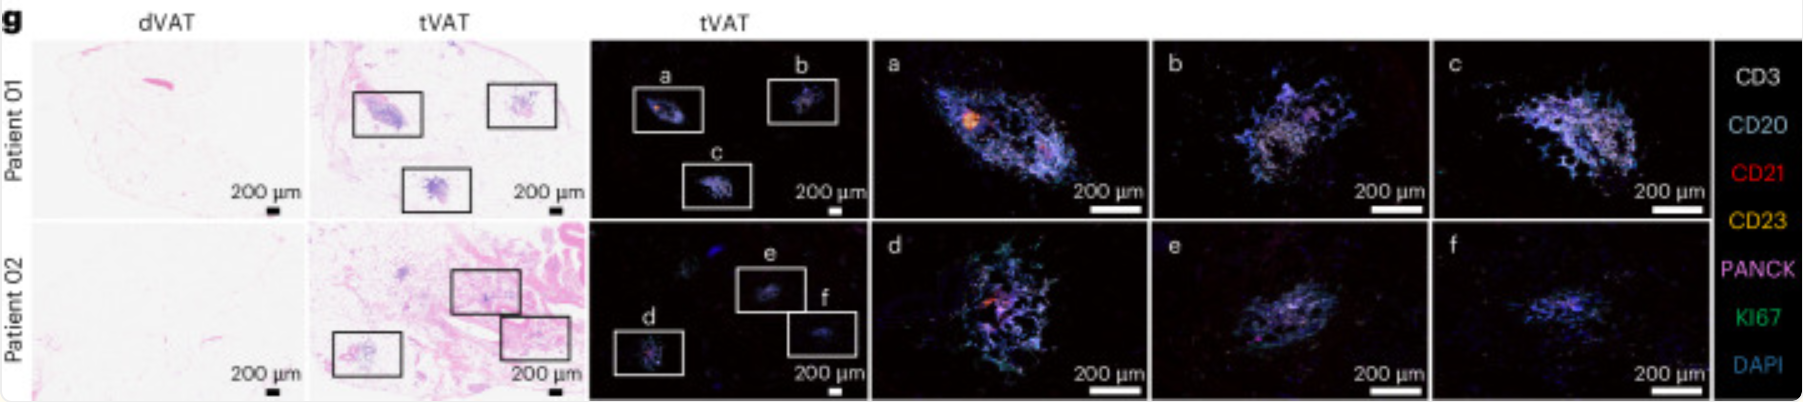
scRNA-seq analysis revealed significant enrichment of lymphocyte infiltration in tVAT, particularly tumor-specific CD8⁺ T cells, with the presence of tertiary lymphoid structures (TLSs) at various maturation stages (Original Fig. 1g, Extended Data Fig. 1e). This confirmed that tVAT is not merely an energy storage tissue but a specialized microenvironment with robust immunological activity.
Fig. 1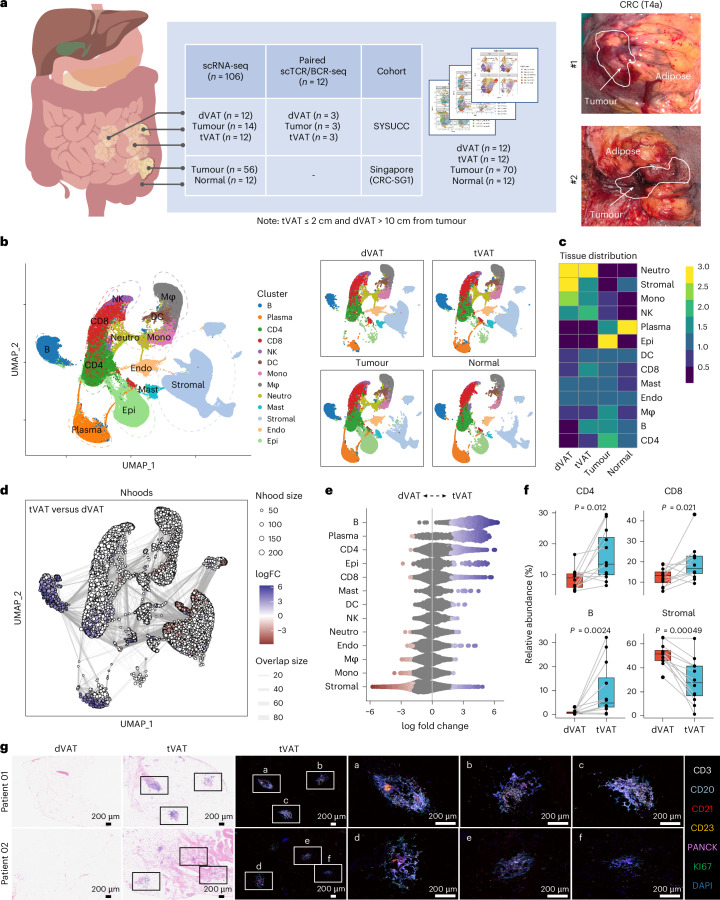
a, Study design illustrating the data analysis (left), and representative images of surgical specimens from patients with CRC (Stage, T4a; right). b, Uniform Manifold Approximation and Projection (UMAP) visualization showing major cell clusters from tumour, normal, tVAT and dVAT samples derived from patients with CRC. The cell types shown NK cells, DC, Mono (monocytes), Mφ (macrophages), Neutro (neutrophils), Mast (mast cells), Endo (endothelial cells) and Epi (epithelial cells). c, Heatmap showing the tissue preferences of 13 cell types by the Ratio of observed to expected (Ro/e) index, illustrating preferential cell type enrichment across different tissue regions. d, UMAP visualization of neighbourhoods (Nhoods) identified by Milo, highlighting the differentially abundant neighbourhoods between tVAT and dVAT. Each Nhood is represented as a node, coloured according to log2 fold change (FC) between tVAT (n = 12) and dVAT (n = 12). Non-differentially abundant neighbourhoods (false discovery rate ≥ 0.1) are displayed in white. Node sizes are proportional to the number of cells in each Nhood, with graph edges representing shared cell quantities between adjacent neighbourhoods. e, Beeswarm plot illustrating the distribution of adjusted log2 FC in abundance of Nhoods between tVAT (n = 12) and dVAT (n = 12) across all cell types. The cell types shown include major immune cell and stromal cell lineages. f, Boxplot comparing the relative abundance of CD4+ T cells, CD8+ T cells, B cells and stromal cells between tVAT (n = 12) and dVAT (n = 12), analysed using a two-sided paired Wilcoxon test. The box hinges denote the first and third quartiles, the median is represented by the centre line and the whiskers encompass the full data range. Individual data points are shown as dots. g, Representative images of hematoxylin and eosin staining (23 samples) and mIHC staining (four samples) for TLSs in dVAT and tVAT sections from patients with CRC. Scale bar, 200 μm. Panel a created in BioRender: Huaiqiang, J. https://biorender.com/vnv4y0b (2026).
Extended Data Fig. 1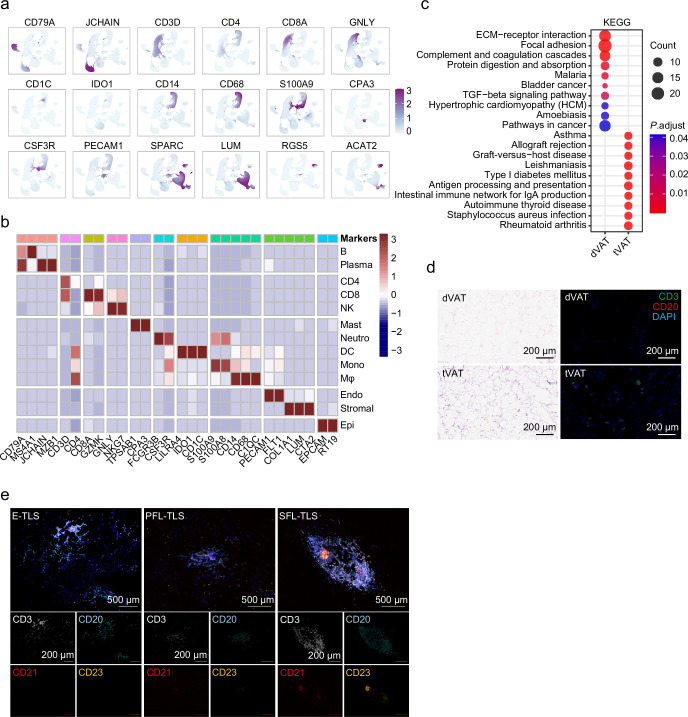
2. tVAT "Sequesters" Immune Cells via the CXCL12-CXCR4 Axis
Following tVAT removal, tumor growth was significantly inhibited, with markedly increased infiltration of CD4⁺ and CD8⁺ T cells within the tumor (Original Fig. 3b-e). The mechanism was clearly defined: adipose-derived cancer-associated fibroblasts (adCAFs) in tVAT secrete high levels of CXCL12, which competitively sequesters immune cells through this signaling axis, blocking their infiltration into the tumor (Original Fig. 4a-b).
Fig. 3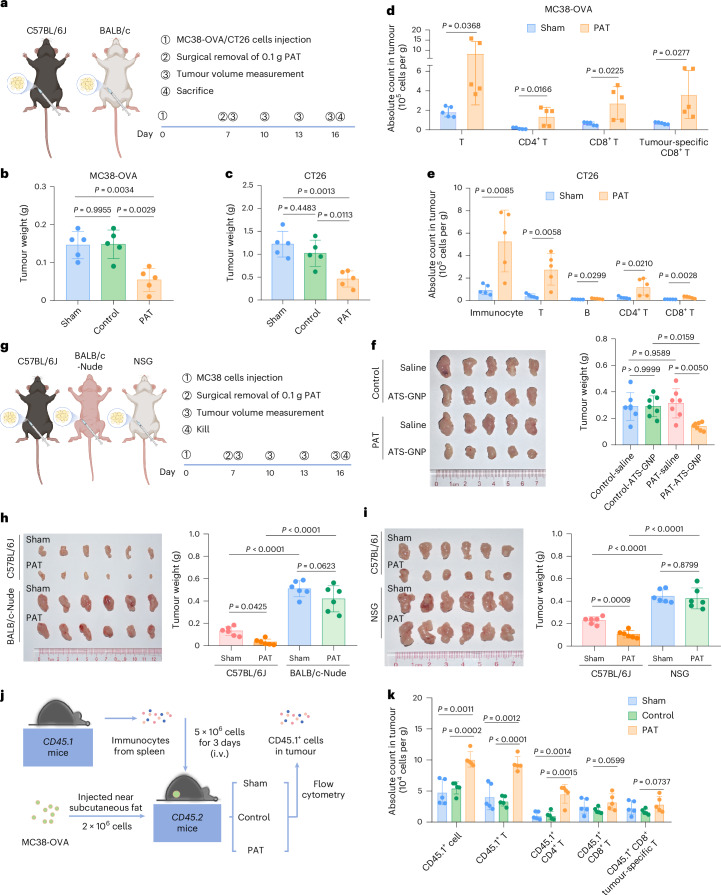
a, Experimental design of the PAT immune-competition model using C57BL/6J or BALB/c mice with the removal of either PAT or contralateral inguinal adipose tissue (control). b,c, Tumour weights of MC38-OVA (b) or CT26 (c) tumours at day 16 of the experiment in C57BL/6J or BALB/c mice (n = 5). d,e, Flow cytometry analysis of the infiltration of T cells, CD4+ T cells, CD8+ T cells, and tumour-specific CD8+ T cells in MC38-OVA (d) or CT26 (e) tumours, with and without removal of PAT (n = 5). To identify OVA-specific CD8+ T cells, H-2Kb tetramers were employed in the MC38-OVA tumour model that endogenously expresses ovalbumin. f, Representative images of MC38 tumours (left) and tumour weights (right) in C57BL/6J mice following removal of PAT or control, and treatment with ATS-GNP or saline (n = 5). g, Experimental design of the PAT immune-deficient model (BALB/c-Nude or NSG) with removal of PAT. h,i, Representative images of MC38 tumours (left) and tumour weights (right) at day 16 in C57BL/6 J, BALB/c-Nude (h), or NSG mice (i) (n = 6). j, Schematic representation of the strategy to detect CD45.1+ cells in MC38-OVA tumours, with and without removal of PAT or contralateral inguinal adipose tissue (control), using the CD45.2 receptor mouse model transferred with CD45.1 splenocytes from CD45.1 donor mice. i.v., intravenous. k, Quantitative analysis of various types of CD45.1+ cells in MC38-OVA tumours with and without removal of PAT or control, as determined by flow cytometry (n = 5). Data represent ≥3 independent experiments. Statistical significance was assessed using a two-sided, unpaired Student’s t-test (d,e,k), one-way analysis of variance (ANOVA) with Tukey’s correction for multiple comparisons (b,c,f right), a two-way ANOVA with Tukey’s correction for multiple comparisons (h right) or a two-way ANOVA with Tukey’s correction for multiple comparisons (i right). Graphs display mean ± s.d. (b–f,h i,k). Panels created with BioRender: a, g and j, Huaiqiang, J. https://biorender.com/f9uacgq (2026).
Fig. 4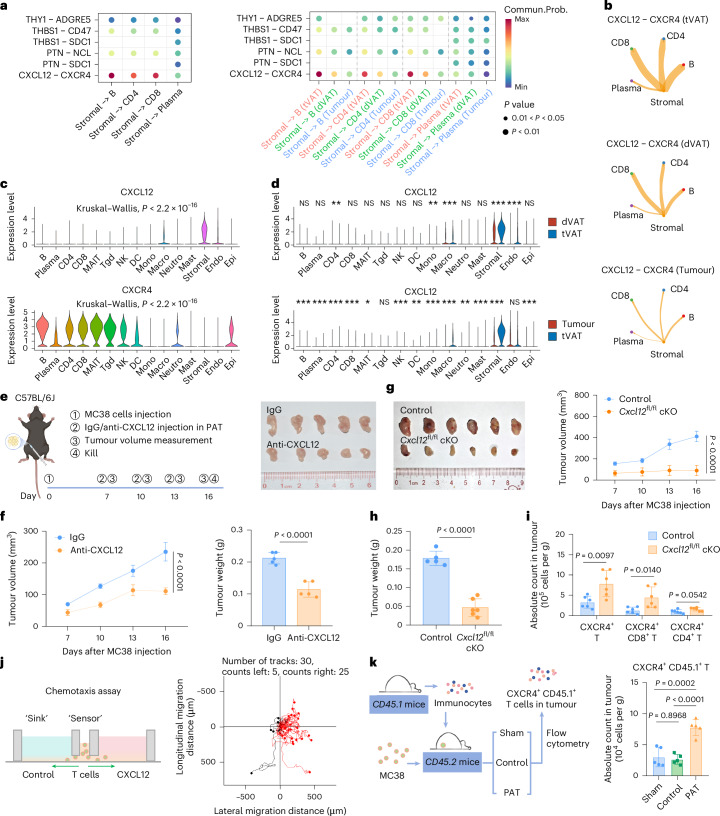 a, Cell–cell communication analysis based on ligand–receptor interactions (top six) between stromal cells and lymphocytes in tVAT (left) and a comparison between tVAT, dVAT and tumour (right). b, Marked CXCL12–CXCR4 interactions among CD8+ T cells, CD4+ T cells, B cells, plasma cells and stromal cell populations in tVAT, dVAT and tumour. The width of the lines represents the probability of communication. c, Violin plots showing the expression of CXCL12 (top) and CXCR4 (bottom) across all cell types in patients with CRC. d, Violin plots comparing the expression of CXCL12 in dVAT versus tVAT (top) and tumour versus tVAT (bottom) in patients with CRC, analysed using a two-sided Wilcoxon test. e, Experimental design for the PAT C57BL/6J mouse model treated with IgG or anti-CXCL12 antibody (left), and representative MC38 tumour images at day 16 of the experiment (right) (n = 5). f, Tumour growth (left) and tumour weights (right) of MC38 tumours at day 16 of the experiment in C57BL/6J mice (n = 5). g, Representative MC38 tumour images (left) and tumour growth (right) of experiments in control and Cxcl12fl/fl cKO mice (n = 6). h, Tumour weights of MC38 tumours in control and Cxcl12fl/fl cKO mice at day 16 of the experiment (n = 6). i, Flow cytometry analysis of the infiltration of various CXCR4+ immune cells in MC38 tumours in Control and Cxcl12fl/fl cKO mice (n = 6). j, Schematic diagram of the chemotaxis assay using T cells as ‘sensors’ and conditional medium as a ‘sink’ (left), and the aggregated trajectories of control or CXCL12-induced T cells migrating for 1 h (right). k, Quantitative analysis of CXCR4+ CD45.1+ T cells in MC38 tumours with and without removal of PAT or contralateral inguinal adipose tissue (control) by flow cytometry (n = 5). Data represent ≥3 independent experiments. Statistical significance was assessed by a two-sided permutation test (a), two-sided unpaired Student’s t-test (f right, h and i), one-way analysis of variance (ANOVA) with Tukey’s correction for multiple comparisons (k right) or two-way ANOVA (f left and g right). Graphs display mean ± s.d. (f–i,k). Panels created with BioRender: e and k, Huaiqiang, J. https://biorender.com/ovq2e39 (2026).
3. Tumor-Induced Adipose-Mesenchymal Transformation Generates adCAFs
Tumor-secreted TGF-β1 induces the directional differentiation of adipose stromal cells into adCAFs, accompanied by significant upregulation of key CAF markers (Original Fig. 6h-i, Extended Data Fig. 7f-g), establishing these cells as the core drivers of immune evasion.
Fig. 6
a, Cell trajectories (top) and cell abundance (bottom) of ASC-derived pAC and ASC-derived adCAFs inferred by Monocle3, with cell trajectories in dVAT (left) and tVAT (right). The pseudotime colour code is shown in the right box. b, Dynamic changes in the expression of several marker genes over time in dVAT (left) and tVAT (right) by monocle3 pseudotime. c, Pseudotime (top) and cell trajectories (bottom) of ASC-derived pAC and ASC-derived adCAFs inferred by Monocle2. The pseudotime colour code is shown in the right box. d, Cell trajectories in dVAT (top) and tVAT (bottom) of ASC-derived pAC and ASC-derived adCAFs inferred by Monocle2. e, Dynamic changes in the expression of several marker genes over time in pAC markers (left) and adCAF markers (right) by monocle2 pseudotime. f, Dot plot showing the inferred differential transcription factor (TF) activities in ASC, pAC and adCAF. g, Dynamic changes in inferred activities and RNA expression levels of TFs in ASC, pAC, and adCAF. h, Representative images of the morphology of mASCs treated with MC38 tumour-derived CM from MC38-derived tumour tissues for 72 h. Scale bar, 100 μm. i, RT–qPCR detecting the RNA expression of adCAF-associated genes (top) and TFs (bottom) in mASCs treated with CM. j, Bar chart of KEGG pathway enrichment analysis showing differentially enriched signalling pathways in mASCs treated with tumour CM. (k) Bar chart of KEGG pathway enrichment analysis showing differentially enriched signalling pathways between adCAF-enriched stromal cells and non-adCAF stromal cells. Data represent ≥3 independent experiments. All data are shown as mean ± s.d. and statistical significance was assessed by a two-sided, unpaired Student’s t-test (i).
Extended Data Fig. 7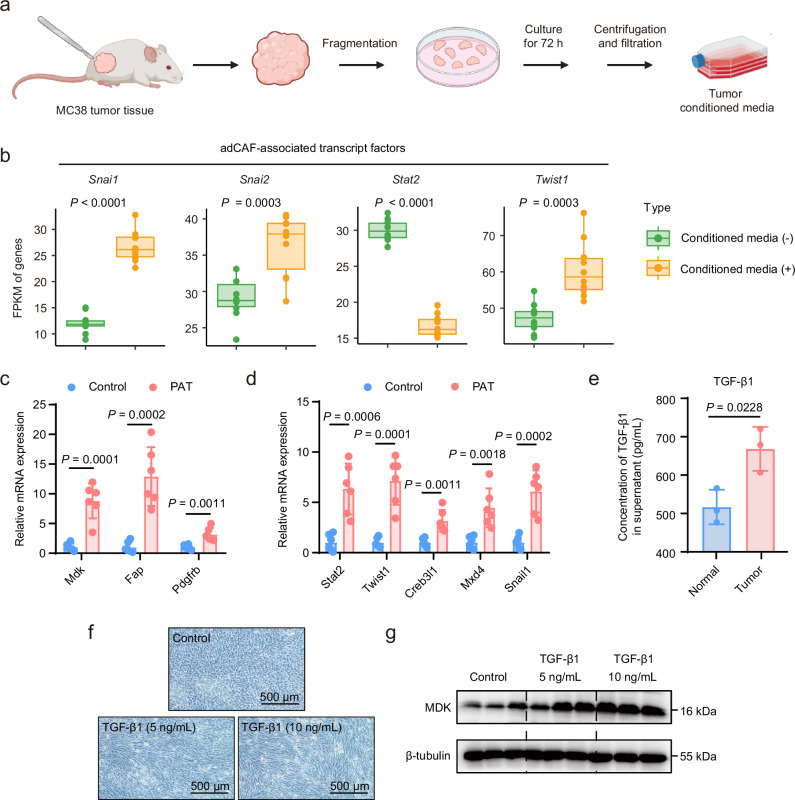
a.Experimental flow chart for dissecting MC38 tumours from tumour-bearing mice and preparing tumour conditioned media. b. RNA sequencing detecting the RNA expression of 4 adCAF-associated transcript factors in mAPCs treated with tumour conditioned media (n = 10). The data are presented as a box-and-whisker graph (bounds of box: first to third quartile, bottom and top line: minimum to maximum, central line: median). Statistical significance was assessed using a two-sided, unpaired Student’s t-test. c. RT-qPCR detecting the RNA expression of adCAF-associated genes in peritumoral adipose tissue (PAT) and contralateral adipose tissue (Control) from MC38 tumour-bearing mice (n = 6). Statistical significance was assessed by a two-sided, unpaired Student’s t-test. d. RT-qPCR detecting the RNA expression of adCAF-associated TFs in PAT and contralateral adipose tissue from MC38 tumour-bearing mice (n = 6). Statistical significance was assessed by a two-sided, unpaired Student’s t-test. e. ELISA detecting the concentration of TGF-β1 in the supernatant of MC38-derived tumours (n = 3) or normal intestinal tissue (n = 3). Statistical significance was assessed using a two-sided, unpaired Student’s t-test. f. Representative images of the morphology of mouse adipose progenitor cells (mAPCs) treated with mouse TGF-β1 protein. g. Western blot analysis detecting the expression of adCAF marker genes (MDK) in mAPCs treated with mouse TGF-β1 protein at concentrations of 5 or 10 ng/mL. Panel created with BioRender: a, Huaiqiang, J. https://biorender.com/y65a209 (2026).
4. Targeting tVAT Significantly Enhances Immunotherapy Efficacy
Clinical data confirmed that tVAT area can precisely predict immunotherapy response (AUC=0.887), with response rates of only 17.1% in patients with high tVAT (Original Fig. 7i-j); targeted blockade of the CXCL12-CXCR4 axis potently enhances anti-PD-1 therapeutic efficacy (Original Fig. 7a-f).
Fig. 7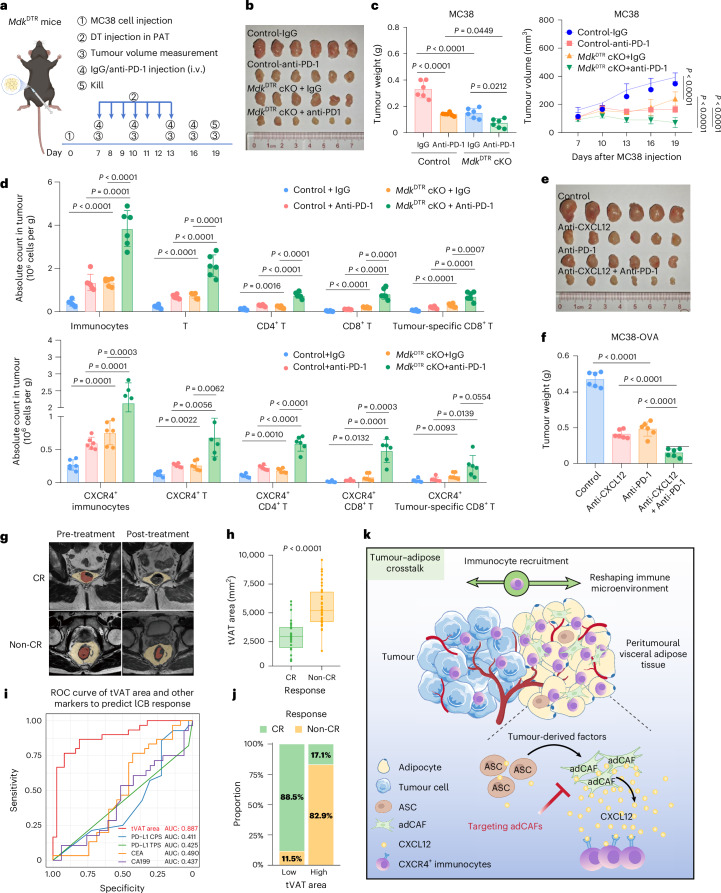 a, Experimental design for constructing Control and MdkDTR cKO mice bearing MC38 tumours near PAT, followed by αPD-1 therapy. b,c, Representative MC38 tumour images (b), tumour weights (c left) and tumour growth (c right) in control and MdkDTR cKO mice treated with IgG or anti-PD-1 (n = 6). d, Flow cytometry analysis of the infiltration of immunocytes, including T cells, CD4+ T cells, CD8+ T cells, and tumour-specific CD8+ T cells, CXCR4+ immunocytes, CXCR4+ T cell, CXCR4+ CD4+ T cell, CXCR4+ CD8+ T cell and CXCR4+ tumour-specific T cell in MC38-OVA tumours from the four treatment groups (n = 6). e,f, Representative MC38 tumour images (e) and tumour weights (f) of the experiment in mice treated with anti-CXCL12 and/or anti-PD-1 (n = 5). g, Representative MRI image of CRC tumour and corresponding tVAT area region of CR and non-CR patients pre- and post-immuno-chemoradiotherapy. The yellow area represents the tVAT area, whereas the red area denotes the tumour region. Note that the mass visible in the intestinal lumen (top right) is faecal material. h, Pre-treatment tVAT area difference based on 3D Slicer between CR (n = 30) and non-CR (n = 37) patients. The data are presented as a box-and-whisker graph (bounds of box show first to third quartile, bottom and top line show minimum to maximum and the central line shows the median). i, ROC plot of response predicting ability of pre-treatment PAT area in immuno-chemoradiotherapy of proficient mismatch repair patients with CRC, compared with conventional indexes, including CPS, TPS, CEA and CA199 (n = 67) with optimal cutoff. j, Comparison of pCR ratio in tVAT high and low group according to the optimal cutoff. k, Graphical abstract depicting how tumours reshape the stromal environment in tVAT and how tVAT competes for immunocytes from the tumour to promote immune escape. Data represent ≥3 independent experiments. Statistical significance was assessed using a two-sided, unpaired Student’s t-test (d,h), one-way ANOVA with Tukey’s correction for multiple comparisons (c left, f) or two-way ANOVA with Tukey’s correction for multiple comparisons (c right). Graphs display mean ± s.d. (c,d,f,h). Panels created with External, opens in a new tab.BioRender: a and k, Huaiqiang, J. External, opens in a new tab.https://biorender.com/e5jwcye (2026).
III. abs933 Deeply Empowers Experiments | Applications + Exclusive Product Advantages
1. Actual Application Sites in the Article (Evidence-Based)
The research team utilized abs933 for blocking throughout the following critical section staining experiments:
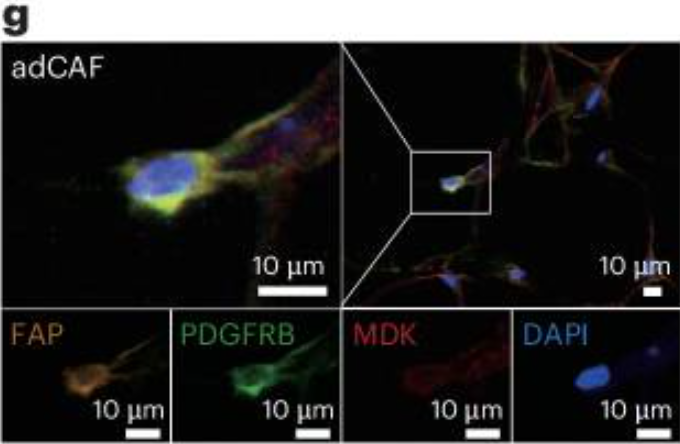
- ✅ Multiplex immunohistochemistry (mIHC) validation of adCAFs spatial distribution within tVAT (Original Fig. 5g)
- ✅ Immunofluorescence (IF) detection of differential lymphocyte infiltration (Extended Data Fig. 1d)
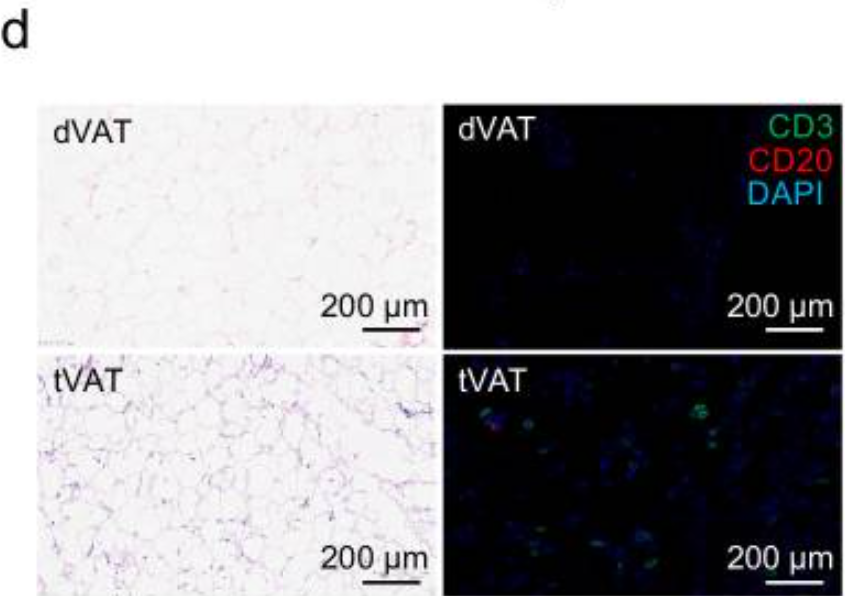
- ✅ Specific staining for cellular composition of tertiary lymphoid structures (TLSs) (Original Fig. 1g)
2. Core Product Advantages of Absin abs933 (Essential Highlights for Scientific Research)
① Ultra-low Non-specific Background, Maximizing Signal-to-Noise Ratio in Staining
Rigorous filtration of contaminating proteins and heterologous antibody interference, perfectly adapted for challenging samples such as adipose tissue and dense tumor tissues, completely avoiding background mottling and fluorescent diffusion issues, ensuring clear and readable imaging of adCAFs and T cell localization, meeting high-impact journal image quality control standards.
② Antigen-Preserving Formulation, Protecting Native Epitopes
Prepared through gentle sterile high-purity processes, avoiding strong acid or base modifications, the blocking procedure does not damage adipose interstitial or membrane protein antigenic sites, ensuring specific primary antibody binding efficiency and eliminating false negatives or weak signal errors.
③ Compatible with Multicolor Multiplex Staining, Eliminating Cross-Reactivity
Specifically optimized for mIHC and multi-label immunofluorescence systems, with excellent goat serum matrix compatibility, no incompatibility with mainstream primary/secondary antibody combinations such as rabbit anti- and mouse anti-, ensuring stable and reproducible results in multi-marker co-localization experiments.
④ Sterile Quality Control + Batch Consistency, Zero Variability in Long-term Experiments
Full aseptic filling with strict endotoxin control, highly uniform protein concentration and activity across batches, for animal tissue experiments and long-term gradient validation experiments, eliminating the need for frequent condition optimization or reagent changes, significantly reducing experimental rework rates.
⑤ Ready-to-Use Format, Efficient and Convenient for High-throughput Experiments
No need for self-dilution, inactivation, or formulation; open and use directly for section blocking, suitable for high-throughput batch staining in research groups, saving time on preliminary reagent preparation and accelerating mechanistic validation progress.
It is precisely by leveraging these robust advantages of abs933 that the research team was able to accurately present cellular spatial distribution, clearly distinguish positive signals, and provide solid and credible morphological evidence for the core immune sequestration mechanism, facilitating the successful publication of these findings in a high-impact journal.
IV. Clinical Translation Prospects + Brand Empowerment Value
This study establishes a novel pathway connecting "adipose microenvironment – immune evasion – immunotherapy," with the implementation of tVAT-targeted interventions and imaging-based predictive biomarkers providing new directions for personalized treatment of colorectal cancer patients.
Absin abs933, as a best-selling blocking reagent in the fields of tumor immunology, histopathology, and fluorescence imaging, has contributed to thousands of high-impact SCI publications, widely applied in various research scenarios including adipose metabolism, tumor microenvironment, inflammatory immunity, and stem cell staining. We maintain strict control over raw materials and quality standards, using highly stable and compatible reagents to safeguard every cutting-edge scientific research endeavor.
Contact Absin
Absin provides antibodies, proteins, ELISA kits, cell culture, detection kits, and other research reagents. If you have any product needs, please contact us.
| Absin Bioscience Inc. worldwide@absin.cn |
 Follow us on Facebook: Absin Bio Follow us on Facebook: Absin Bio |