

- Cart 0
- English
Pitfall Avoidance Guide for Cell/Tissue Staining: How to Select the Right Fluorescent Dyes/Probes to Achieve Unrestricted Multicolor Imaging
July 09, 2026
Clicks:395


When performing cellular and tissue imaging, have you ever encountered weak signals, high background, channel crosstalk, or live cell death after staining? In fact, the problem may not lie in your operation, but in probe selection and experimental design.
In this comprehensive guide, Absin will systematically sort out full-workflow strategies from probe matching, multicolor combination to data interpretation, helping you eliminate repeated trial and error and achieve efficient research with "one-round imaging, multiple validations".
I. Clarify Research Objectives Before Selecting Dyes/Probes: What Exactly Do You Intend to Observe?
Cellular imaging is not merely about "visualization", but "comprehensive interpretation".
Select corresponding probes based on your research focus:
Dynamic signals (e.g., calcium ions, ROS, NO) → Functional activity probes
Cellular structures (e.g., membrane, cytoskeleton, lipid droplets) → Structural probes
Organelle functions (e.g., mitochondrial membrane potential, lysosomal activity) → Organelle-specific probes
Spatial distribution and interaction of multiple proteins in tissues → Multiplex immunofluorescence staining kits
II. Core Probe Toolkit: Precise Selection Based on Scientific Questions
1. Functional Activity Probes: Capture Dynamic Signals
Designed to detect intracellular ion concentrations and signal molecules such as reactive oxygen/nitrogen species, applicable to signal transduction, oxidative stress, metabolic regulation and other research fields.
|
Category |
Probe Name |
λEx(nm) / λEm (nm) |
Application Guide |
|
Ca²⁺ Probes |
Fluo 3-AM |
506/526 |
Dynamic calcium monitoring |
|
Fluo 4-AM |
494/516 |
High-sensitivity calcium detection |
|
|
Rhod-2 AM |
557/581 |
Calcium signal in red channel |
|
|
ROS Probes |
DCFH-DA |
502/523 |
Total ROS detection |
|
DHE |
530/610 |
Superoxide anion (·O₂⁻) detection |
|
|
HPF |
490/515 |
Hydroxyl radical (·OH) detection |
|
|
NO Probe |
DAF-FM DA |
495/515 |
Real-time nitric oxide monitoring |
|
H₂S Probe |
WSP-5 |
502/525 |
Hydrogen sulfide detection |
2. Membrane & Lipid Probes: Resolve Structures and Transport Pathways
Applied for cell membrane visualization, lipid raft localization, cell tracing and exosome labeling.
|
Dye Name |
λEx(nm) / λEm (nm) |
Application Guide |
|
CTB-FITC |
488/520 |
Lipid raft (GM1) labeling |
|
DiI / DiO |
549/565; 484/501 |
Cell membrane labeling, cell tracing, exosome labeling |
|
PKH26 / PKH67 |
551/567; 490/502 |
Cell membrane labeling, cell tracing, exosome labeling |
|
DiD / DiR |
644/663; 748/780 |
Deep tissue imaging, exosome labeling |
|
Laurdan |
364/498 |
Identification of cell membrane phospholipid phases |
|
Cell Tracker CM-DiI |
553/570 |
More suitable for fixed cell staining |
3. Cytoskeleton Staining
For visualization of F-actin microfilaments, applicable to researches on cell morphology, migration, cytoskeleton remodeling, bacteria-host cell interaction, etc.
|
Dye Name |
λEx(nm) / λEm (nm) |
Fluorescence Color |
|
Rhodamine-conjugated Phalloidin |
540/565 |
Orange-red |
|
Phalloidin-Fluor 488 |
493/517 |
Green |
|
Phalloidin-Fluor 555 |
556/574 |
Orange-red |
|
Phalloidin-Fluor 594 |
590/618 |
Red |
|
Phalloidin-Fluor 647 Conjugate |
640/654 |
Far-red |
|
Phalloidin-Fluor 680 Conjugate |
684/701 |
Far-red |
4. Lipid Staining
For detection of neutral lipid droplets, cholesterol and other lipid structures.
|
Dye Name |
λEx(nm) / λEm (nm) |
Application Guide |
|
Filipin III |
360/480 |
Specific staining for free cholesterol |
|
Oil Red O |
628/684 |
Lipid droplet staining (tissue/cell samples) |
|
BODIPY 493/503 |
493/503 |
Live cell imaging of lipid droplets |
5. Organelle & Structural Probes: Map Cellular Spatial Architecture
Nucleus
|
Dye Name |
λEx(nm) / λEm (nm) |
Application Guide |
|
DRAQ5 |
594/666 |
Live cells, compatible with multicolor labeling |
|
DRAQ7 |
633/695 |
Dead/fixed/membrane-damaged cells |
|
DAPI Staining Solution |
364/454 |
Classic nuclear counterstain for immunofluorescence |
|
Hoechst 33342 |
350/461 |
Long-term live cell imaging |
|
7-AAD |
545/650 |
Flow cytometry live/dead discrimination, immunophenotyping |
|
PI Staining Solution |
535/617 |
Cell cycle and apoptosis analysis |
Mitochondria
|
Dye Name |
λEx(nm) / λEm (nm) |
Application Guide |
|
JC-1 |
514/529; 585/590 |
Mitochondrial membrane potential detection |
|
MitoTracker Red CMXRos |
579/599 |
Live cell mitochondrial labeling |
|
MitoScene Green I |
490/523 |
Live cell mitochondrial labeling |
|
MitoSOX Red |
510/580 |
Mitochondrial superoxide detection |
|
Calcein-AM |
490/515 |
Mitochondrial permeability transition pore assay |
III. Advanced Imaging Tips: Unravel Mechanistic Cascades via Multicolor Colocalization
Single staining only answers "what", while multicolor colocalization reveals "why".
Below are probe combination strategies for four typical research scenarios:
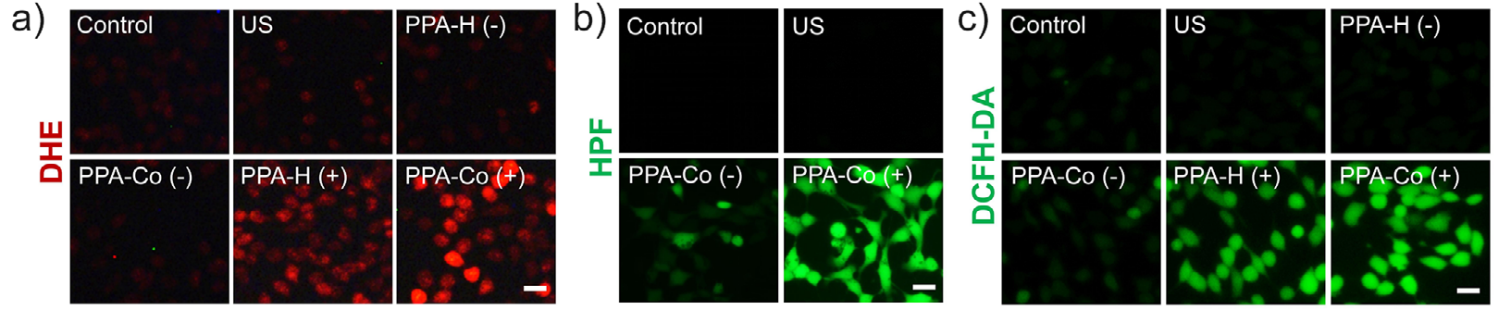
Scenario 1: Anticancer Mechanism of Nanomaterials → Elucidate ROS Generation Pathways
Combination: DHE (·O₂⁻) (abs810256) + HPF (·OH) (abs42026818) + DCFH-DA (Total ROS) (abs42197174).
Rationale: Distinguish whether materials induce ROS via electron transfer or Fenton-like reactions by comparing signal intensities of three ROS probes, directly linking to subsequent mitochondrial damage and cell death [1].
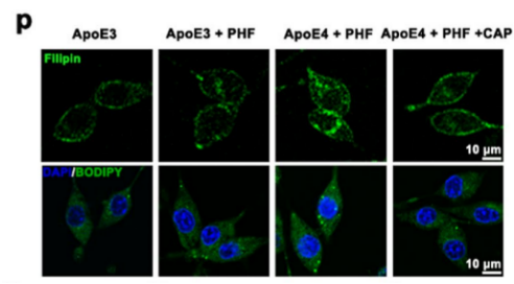
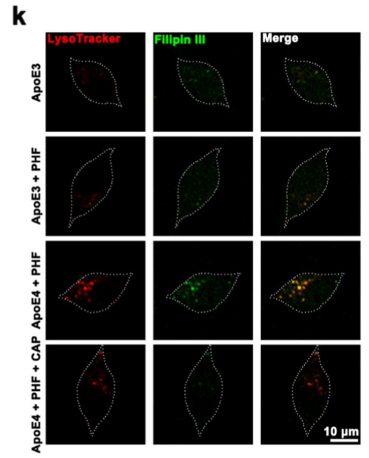
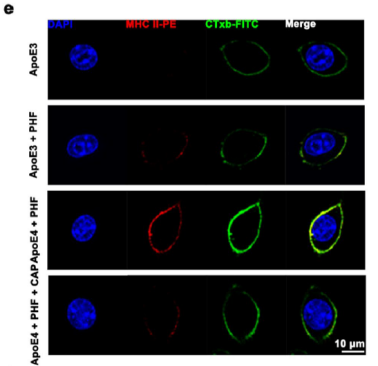
Scenario 2: Cholesterol-Lysosome Colocalization → Lipid Raft Localization → Pathological Study of Alzheimer’s Disease
Combination: Filipin III (Cholesterol) (abs42018484) + LysoTracker Red (Lysosome) (abs47038871) + CTB-FITC (Lipid Raft) (abs80003).
Rationale: Observe cholesterol accumulation in lysosomes and lipid raft structural disruption, to establish a complete pathological cascade: Genotype → Metabolic Abnormality → Structural Damage → Functional Dysfunction[2].
 |
 |
 |
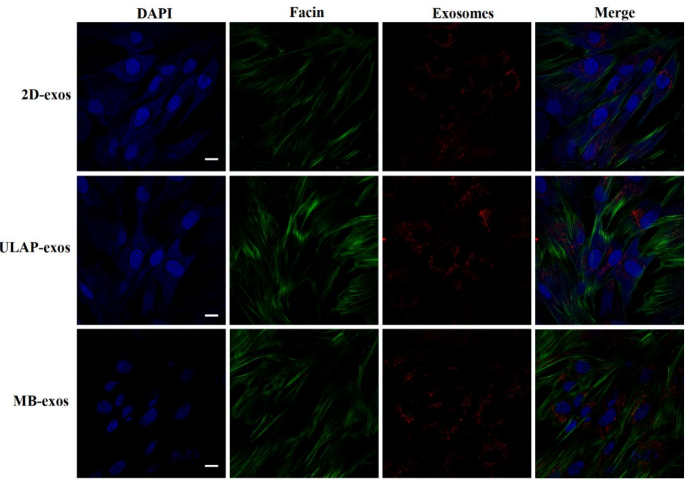
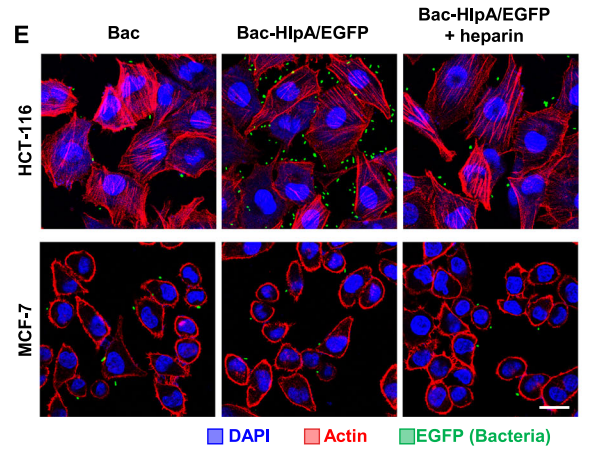
Scenario 3: Exosome Uptake Process → Dynamic Tracing and Cytoskeleton Correlation
Combination: PKH26 (Exosome Membrane) (abs9819) + Phalloidin-Alexa Fluor 488 (Recipient Cell Cytoskeleton) (abs47048271) + DAPI (Nucleus) (abs47047616).
Rationale: Time-lapse imaging directly visualizes how exosomes are internalized and transported along cytoskeletal networks. This strategy is also applicable to bacteria-host cell interaction and drug delivery carrier research[3-4].
 |
 |
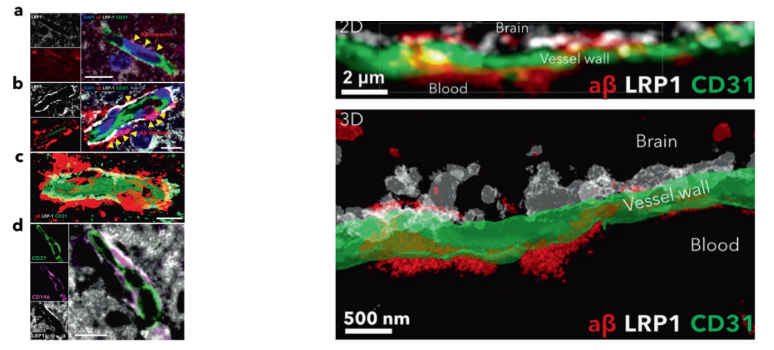
Scenario 4: Impaired Waste Clearance in Alzheimer’s Disease → LRP1-Mediated Aβ Clearance Mechanism Study
Combination: TSA Signal Amplification Kit (abs50031): Aβ (Red) + LRP1 (White) + CD31 (Green) + DAPI (Blue)
Rationale: Multicolor confocal imaging evaluates the colocalization of Aβ and LRP1 in cerebral vascular endothelial cells to quantify LRP1-dependent Aβ clearance efficiency, suitable for Alzheimer’s disease mechanism and therapeutic drug research[5].
1. Eliminate Spectral Crosstalk: Before designing multicolor experiments, check the excitation/emission spectra of all dyes. Utilize the spectral unmixing function of confocal microscopes or flow cytometers to separate overlapping fluorescence signals effectively. Single-stain controls must be set for each experiment to accurately adjust compensation parameters.
2. Cytotoxicity of Live Cell Staining: The solvent of many AM ester probes (e.g., Fluo-4 AM, Calcein-AM) may induce cellular toxicity. Recommended operations: Load probes in buffer supplemented with low-concentration Pluronic F-127 (abs42155849); thoroughly wash cells after incubation; assess cell viability under staining conditions using CCK-8 Assay Kit (abs50003).
3. Photobleaching and Image Acquisition: Dyes including Filipin III and FITC are prone to photobleaching. Suggestions: Use anti-fade mounting medium (abs9234); complete image capture promptly; fix exposure time across all groups for quantitative comparability.
5. Common Issues & Resolutions
|
Phenomenon |
Potential Causes |
Solutions |
|
Weak fluorescence signal |
Insufficient probe concentration / Short incubation time / Offset excitation wavelength |
Increase probe concentration by 20%, extend incubation for 10–15 min, calibrate equipment wavelength |
|
High background signal |
Insufficient washing / Inadequate blocking / Non-specific probe binding |
Increase washing cycles (3 times), block with 5% BSA (abs9157) for 30 min, reduce probe concentration |
|
Cell death after live cell staining |
Excessive probe toxicity / Improper incubation temperature / Residual permeabilizer |
Cut probe concentration by half, incubate strictly at 37℃, add one extra wash step |
|
Overlapped signals of multiple probes |
Overlapped emission spectra / Excess probe concentration |
Switch to probes with separated wavelengths, lower individual probe dosage |
V> From Visualization to Interpretation: Absin Stands Beside Your Research Journey
In pursuit of scientific truth, high-quality, accurate multicolor imaging is the core tool to visualize complex molecular mechanisms and strengthen the persuasiveness of your research story. Nevertheless, every step from probe selection, multicolor matching to final imaging contains hidden pitfalls that distort experimental data.
If you are currently facing:
1. Searching for optimal visualization validation protocols for intricate cellular mechanisms;
2. Investigating spatial relationships of multiple targets simultaneously on tissue sections in tumor immunology, neuroscience, metabolic diseases and other disciplines;
3. Or simply aiming to cut trial-and-error time and rapidly acquire publishable high-quality imaging data;
Then the challenges you encounter are exactly what we commit to resolve.
Absin delivers far more than a product catalog:
We focus on converting research tools into your conclusive experimental data. Our portfolio covers hundreds of high-specificity probes for cellular function, structure and organelle labeling, TSA multiplex immunohistochemistry kits with signal amplification and low crosstalk performance for tissue samples, as well as professional imaging scheme design and technical support. We strive to be your reliable partner throughout scientific research.
Let us help you devote more time to scientific hypothesis, rather than repetitive trial and error.
Next Steps for You:
1. Online Technical Consultation: Describe your research mechanism or specific imaging troubles to obtain customized experimental schemes.
2. Official Website Visit (https://www.absin.net/): Look up catalog numbers mentioned in this article (e.g., abs80003) and download full technical datasheets.
3. Contact Technical Support: Get one-on-one professional support covering scheme design to result analysis.
References:
[1] Angew Chem Int Ed Engl. 2025 Dec 1:e20043. doi: 10.1002/anie.202520043. Online ahead of print.
[2] Transl Neurodegener. 2024 Oct 29;13(1):52. doi: 10.1186/s40035-024-00445-6.
[3] Zhang PP. Study on the effects and mechanism of placenta mesenchymal stem cell-derived exosomes from spheroid culture on senescent stem cells[D]. Nanjing Medical University, 2024. DOI:10.27249/d.cnki.gnjyu.2024.001586.
[4] Nat Commun. 2023 Mar 23;14(1):1606. doi: 10.1038/s41467-023-37225-1.
[5] Signal Transduct Target Ther. 2025 Oct 7;10(1):331. doi: 10.1038/s41392-025-02426-1.
Contact Absin
Absin provides antibodies, proteins, ELISA kits, cell culture, detection kits, and other research reagents. If you have any product needs, please contact us.
| Absin Bioscience Inc. worldwide@absin.cn |
 Follow us on Facebook: Absin Bio Follow us on Facebook: Absin Bio |