- Cart 0
- English
Breaking the Gemcitabine Resistance Barrier in Extrahepatic Cholangiocarcinoma | Absin Powers Top-Tier Research: Targeting the CAF-HGF-c-MET Axis to Restore Therapeutic Efficacy
April 13, 2026
Clicks:81
Extrahepatic cholangiocarcinoma (eCCA) is characterized by high malignancy, insidious onset, and propensity for metastasis. First-line chemotherapy with gemcitabine frequently becomes ineffective due to acquired drug resistance. How do cancer-associated fibroblasts (CAFs) in the tumor microenvironment (TME) drive tumor progression and therapeutic resistance? A landmark study published in Acta Pharmaceutica Sinica B provides compelling evidence, with the Absin Organoid ATP Viability Assay Kit supporting pivotal drug sensitivity experiments throughout, offering precise translational evidence for clinical combination therapy strategies.
Article Title: Targeting cancer-associated fibroblast-activated HGF/c-MET pathway inhibits extrahepatic cholangiocarcinoma progression and restores gemcitabine therapeutic sensitivity
Journal: Acta Pharmaceutica Sinica B (IF=14.6)
DOI: https://doi.org/10.1016/j.apsb.2026.02.023
Absin Product Used: Mouse TNF-α ELISA Kit (Cat#: abs50059)
I. Core Research Strategy: From Microenvironment to Therapeutic Targets, Closing the Loop on Drug Resistance
The research team established an integrated eCCA preclinical platform encompassing primary cell lines, patient-derived organoids (PDOs), and patient-derived xenografts (PDX), systematically addressing three fundamental scientific questions:
1. Do CAFs promote eCCA proliferation, invasion, and gemcitabine resistance?
2. What are the key effector molecules secreted by CAFs?
3. Can targeting these factor-mediated pathways reverse drug resistance and enhance chemotherapy efficacy?
Key Models and Technical Approaches
● Specimens: 10 clinical eCCA tissue samples used to establish matched CAFs, primary cell lines, PDOs, and PDX models
● Mechanism: Cytokine array profiling → Identification of HGF → Activation of c-MET/PI3K/AKT signaling axis → Drug resistance induction
● Intervention: c-MET inhibitors (JNJ-38877605 / Crizotinib) combined with gemcitabine therapy
● Validation: Triple corroboration using 2D cell culture, 3D organoid models, and in vivo animal studies
II. Landmark Findings: The CAF-HGF-c-MET Axis as the Core Mechanism of eCCA Drug Resistance
1. CAFs Drive Comprehensive Malignant Progression of eCCA (Original Fig. 2)
● In vitro: CAF-conditioned medium (CM) significantly enhanced eCCA cell proliferation, migration, and invasive capacity
● 3D Organoids: CAF co-culture significantly increased organoid number and volume
● In vivo: CAF co-injection resulted in accelerated tumor growth and elevated Ki-67 expression in murine models
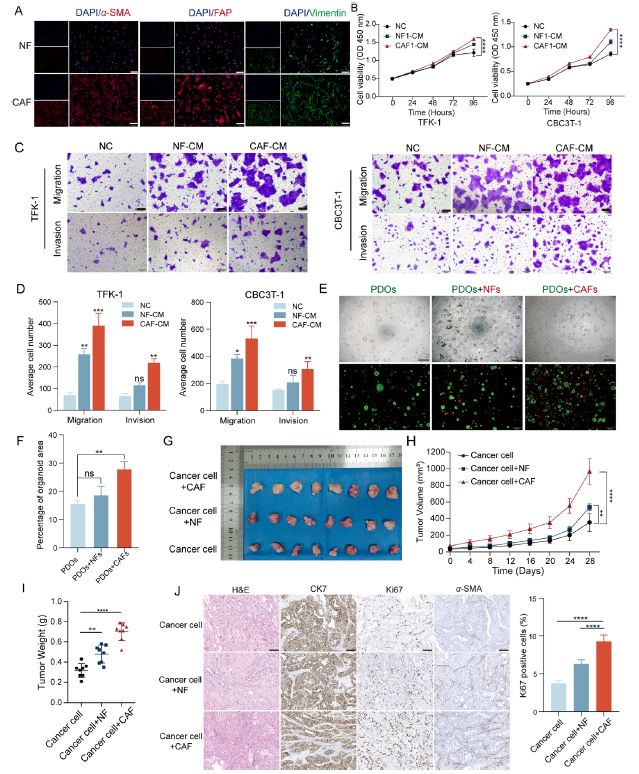
Figure 2 Effect of CAFs on eCCA progression. (A) Immunofluorescence staining of CAFs/NFs showed positive expression of α-SMA, Vimentin and FAP. Scale bar: 200 μm. (B) Effect of CAF-CM/NF-CM on proliferation of TFK-1 and CBC3T-1 cells. Negative control (NC) (n = 3). (C, D) Effect of CAF-CM/NF-CM on migration and invasion of TFK-1 and CBC3T-1 cells (n = 3). Scale bar: 200 μm. (E, F) Representative fluorescent images of PDOs monocultures or co-cultures with CAFs/NFs and quantitative analysis of total organoid area (n = 3). PDOs (green), CAFs/NFs (red). Scale bar: 200 μm. (G) Representative tumor images of cell-derived xenografts: cancer cells, cancer cells + NFs and cancer cells + CAFs. (H, I) Mean tumor volume and tumor weight (n = 8). (J) Representative images of H&E and IHC staining of α-SMA, CK7 and Ki67 (n = 8). Data are shown as mean ± SD. ns, no significance; *P < 0.05; **P < 0.01; ***P < 0.001; ****P < 0.0001.
2. HGF is the Critical Secreted Effector of CAF-Mediated Tumorigenesis (Original Fig. 3)
● Cytokine array analysis revealed HGF as the most significantly upregulated factor in CAF-CM
● ELISA validation: CAFs secreted substantially higher levels of HGF compared to normal fibroblasts (NFs)
● Neutralizing antibody experiments: HGF blockade reversed the pro-tumorigenic effects of CAFs
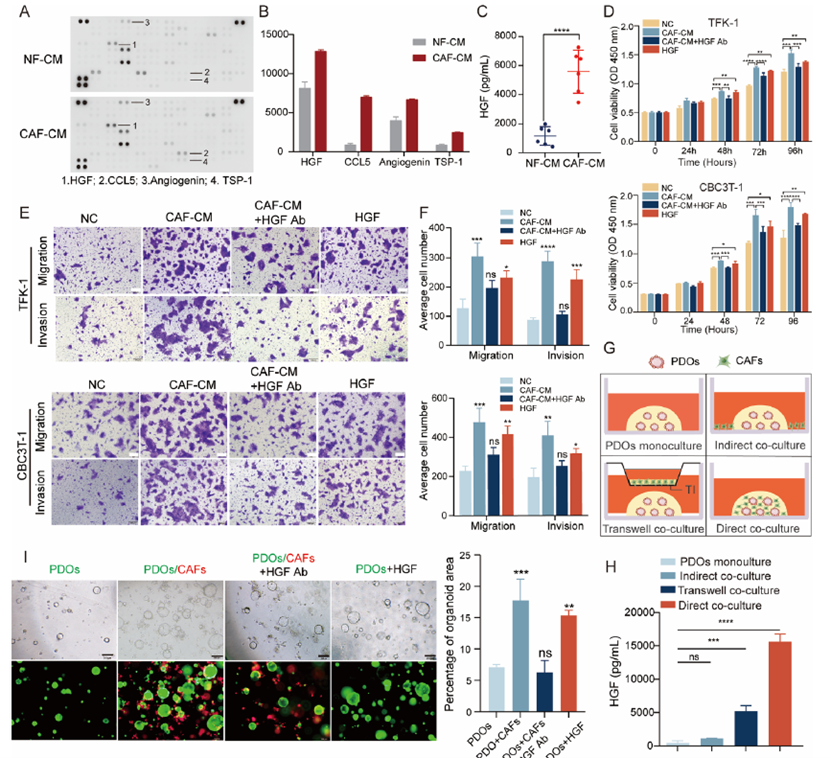
Figure 3 HGF is a key cytokine in CAF-CM affecting eCCA progression. (A, B) Cytokine expression of CAF-CM and NF-CM was detected by cytokine array. HGF, CCL5, Angiogenin and TSP-1 expression was significantly elevated. (C) Levels of HGF in conditioned media from CAFs and NFs derived from six patients with eCCA, measured by ELISA (n = 6). (D) Viability of eCCA cells under different treatment conditions-normal control (NC), CAF-CM, CAF-CM with HGF-neutralizing antibody (CAF-CM + HGF Ab), and recombinant HGF (HGF)—measured at 0, 24, 48, 72, and 96 h (n = 3). (E, F) Representative images of Transwell assay of eCCA cells treated with CAF-CM or CAF-CM + HGF Ab or HGF for 48 h (n = 3). Scale bar: 200 μm. (G, H) Schematic and ELISA-based quantitative analysis of HGF secretion in different co-culture models (n = 3): (i) PDO monoculture; (ii) indirect co-culture in which CAFs are seeded in the matrix surrounding PDOcontaining Matrigel; (iii) indirect co-culture using a Transwell insert (TI) to allow paracrine interaction without physical contact; (iv) direct co-culture in which PDOs and CAFs are co-embedded in Matrigel to allow cell—cell contact. (I) Representative fluorescence images of organoids in monoculture or direct co-culture with CAFs under different conditions and quantitative analysis of total organoid area (n = 3). Scale bar:200 μm. Data are shown as mean ± SD. ns, no significance; *P < 0.05; **P < 0.01; ***P < 0.001; ****P < 0.0001.
3. HGF/c-MET/PI3K/AKT Signaling Mediates Gemcitabine Resistance (Original Fig. 4/5)
• HGF binding to c-MET activates downstream PI3K/AKT phosphorylation
• c-MET is highly expressed in drug-resistant cells, with HGF further reducing gemcitabine sensitivity
• c-MET inhibition blocks pathway activation and restores tumor response to gemcitabine

Figure 4 Inhibition of HGF/c-MET signaling pathway suppresses CAFs-induced eCCA progression. (A) Representative IHC images of c-MET expression in eCCA (n = 27) and para-tumor tissues (n = 9). (B) IHC staining intensity of c-MET in eCCA tissues (n = 27) and para-tumor tissues (n = 9) of TMAs. (C) Representative images of multiplex immunofluorescence staining (α-SMA, green; p-c-MET, yellow; CK19, red) in eCCA and para-tumor tissue. (D) Percentage of p-c-MET +CK19 +cells to CK19 +cells in eCCA tissues and para-tumor tissues. (E) Mean fluorescence intensity of α-SMA +in eCCA and para-tumor tissues. (F) Western blot analysis of p-c-MET, total c-MET, p-PI3K, total PI3K, p-AKT, and total AKT in TFK-1 and CBC3T-1 cells treated with recombinant HGF at different time points (15, 30, 60, 120 min). (G, H) Western blotting of the c-MET/PI3K/AKT signaling pathway in TFK-1 and CBC3T-1 cells under the following conditions: normal control (NC), CAFCM, CAF-CM supplemented with an HGF-neutralizing antibody (CAF-CM + HGF Ab), or recombinant HGF (n = 3). (I, J) Western blot analysis of c-MET/PI3K/AKT pathway activity in eCCA cells treated with CAF-CM, with or without the c-MET inhibitors JNJ-38877605 or crizotinib (n = 3). Data are shown as mean ± SD. *P < 0.05; **P < 0.01; ***P < 0.001; ****P < 0.0001.
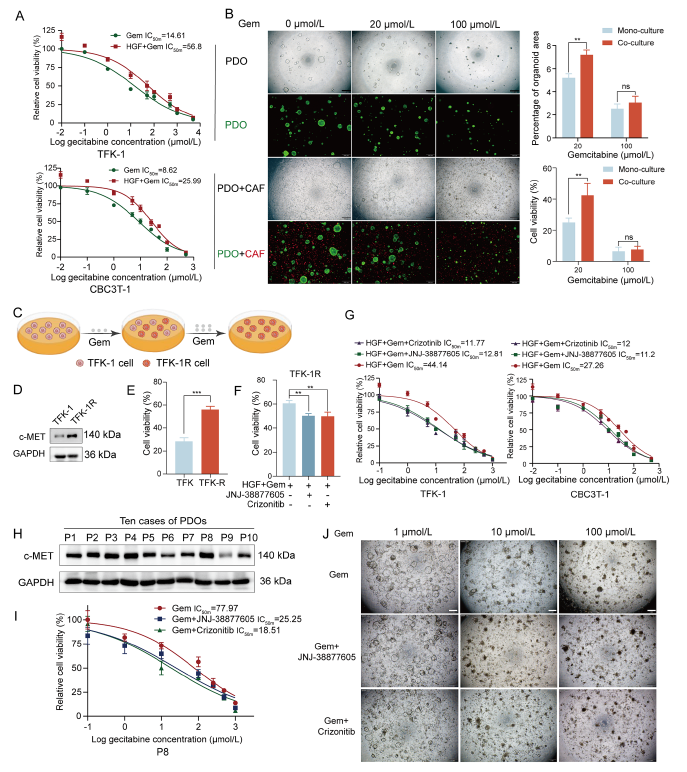
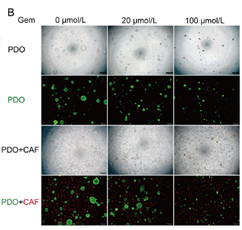
Figure 5 Targeting the HGF/c-MET signaling pathway enhances gemcitabine treatment sensitivity in vitro. (A) Cell viability of TFK-1 and CBC3T-1 cells treated with gemcitabine or gemcitabine combined with HGF (n = 3). (B) Representative images of the sensitivity of gemcitabine to PDOs monoculture systems or direct co-culture systems with CAFs (n = 3). PDOs (green), CAFs (red). The percentage of total area of the PDOs was quantified and the viability was determined. Scale bar: 500 μm. (C) Schematic diagram for the construction of TFK-1 gemcitabineresistant cells (TFK-1R). (D) Western blot analysis of c-MET protein levels in parental TFK-1 cells and gemcitabine-resistant TFK-1 cells (TFK-1R). (E) Cell viability of 100 μmol/L gemcitabine-treated TFK-1 and TFK-1R cells (n = 3). (F) Cell viability of TFK-1R cells treated with 100 μmol/L gemcitabine or in combination with c-MET inhibitor under conditions of added HGF (n = 3). (G) Dose—response curves of gemcitabine alone or in combination with c-MET inhibitors for treatment of TFK-1 and CBC3T-1 cells under conditions of added HGF (n = 3). (H) Western blot analysis of c-MET protein levels in PDOs established from 10 cases of eCCA. (I, J) Representative images and dose—response curves of gemcitabine alone or in combination with c-MET inhibitor in a direct co-culture system of PDOs and CAFs. Patient 8 (P8) (n = 3). Scale bar: 500 μm. Data are shown as mean ± SD. ns, no significance; **P < 0.01; ***P < 0.001.
4. Combination Therapy Demonstrates Significant Efficacy in Organoid and PDX Models (Original Fig. 6/7)
• Gemcitabine monotherapy showed limited efficacy, while c-MET inhibitor combination significantly suppressed tumor growth
• High concordance between organoid drug sensitivity and PDX pharmacodynamics supports clinical translation
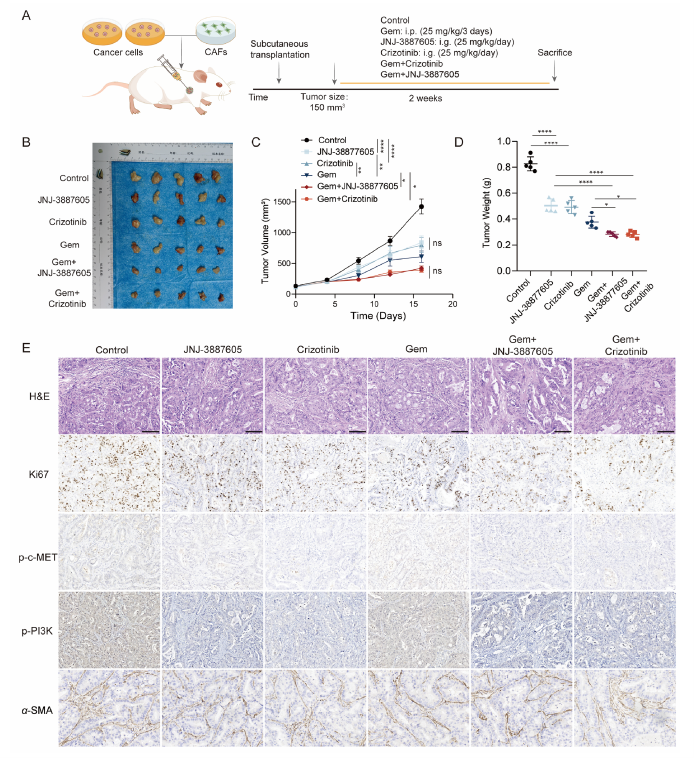
Figure 6 The combination of gemcitabine and c-MET inhibitors reduced cell-derived xenotransplantation growth. (A) Schematic diagram of he process of co-injection of cancer cells and CAFs into mice subcutaneously. (B—D) Representative tumor images of cell-derived xenografts treated with gemcitabine, c-MET inhibitors, or gemcitabine combined with c-MET inhibitor. Tumor volume and mass were calculated (n = 5).(E) H&E and IHC staining were used to assess the expression of Ki67, p-c-MET, p-PI3K and α-SMA in subcutaneous tumor tissues of mice. i.p., intraperitoneal injection; i.g., intragastric. Scale bar, 100 μm. Data are shown as mean ± SD. ns, no significance; *P < 0.05; **P < 0.01;****P < 0.0001.
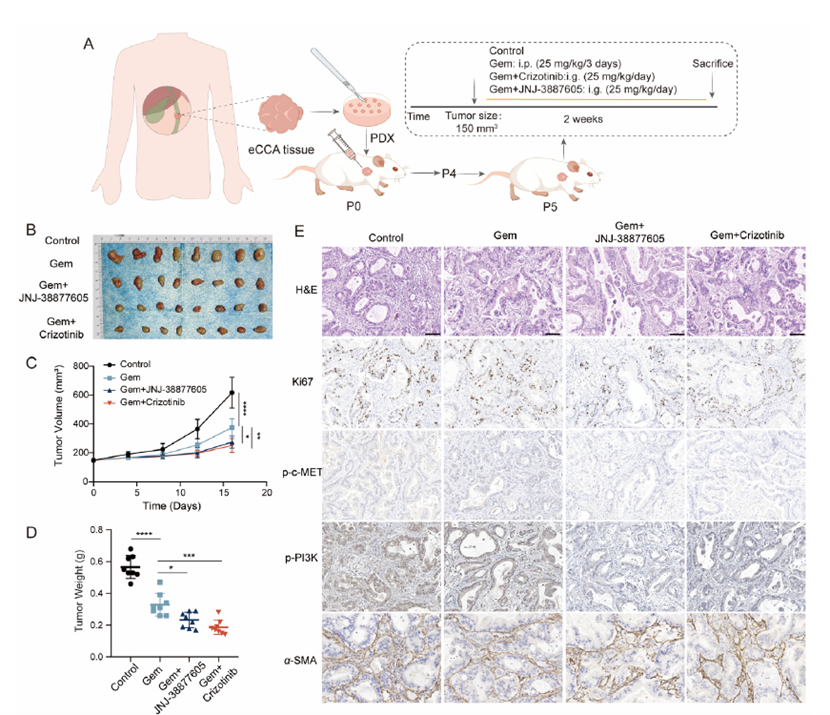
Figure 7 The combination of gemcitabine and c-MET inhibitors reduced PDX tumor growth. (A) Schematic diagram of the PDX model construction process used for screening drugs. Passage 0 (P0), passage 4 (P4), passage 5 (P5). (B) Representative tumor images of PDX treated with gemcitabine alone or gemcitabine in combination with c-MET inhibitors. (C, D) Tumor volume and mass statistics (n = 8). (E) H&E and IHC staining were used to assess the expression of Ki67, p-c-MET, p-PI3K and α-SMA in PDX tissues. Scale bar, 100 μm. Data are expressed as mean ± SD. *P < 0.05; **P < 0.01; ****P < 0.0001.
III. Absin Core Product Support: Organoid ATP Viability Assay Kit
✅ Product Used in This Study
✅ Experimental Applications (Original Methods 2.12 / Fig. 5B / Fig. 5I-J)
• 3D direct co-culture drug sensitivity assays with PDOs and CAFs
• Quantitative viability assessment of organoids treated with gemcitabine alone or combined with c-MET inhibitors
• High-throughput, precise quantification of tumor cell survival and drug response in 3D models
 |
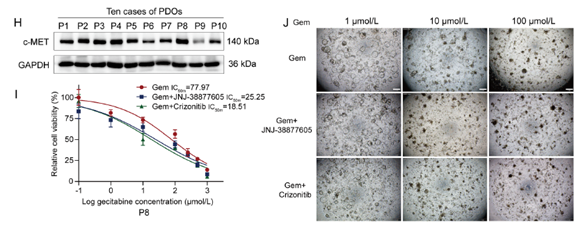 |
Figure 5 Targeting the HGF/c-MET signaling pathway enhances gemcitabine treatment sensitivity in vitro. (B) Representative images of the sensitivity of gemcitabine to PDOs monoculture systems or direct co-culture systems with CAFs (n = 3). PDOs (green), CAFs (red). The percentage of total area of the PDOs was quantified and the viability was determined. Scale bar: 500 μm.(I, J) Representative images and dose—response curves of gemcitabine alone or in combination with c-MET inhibitor in a direct co-culture system of PDOs and CAFs. Patient 8 (P8) (n = 3).Scale bar: 500 μm. Data are shown as mean ± SD. ns, no significance; **P < 0.01; ***P < 0.001.
✅ Key Product Advantages
1. Optimized for 3D Culture Systems
Lysis buffer efficiently penetrates Matrigel and dense organoid structures, preventing false-negative detection of viable cells
2. High-Sensitivity Bioluminescence Detection
ATP content shows linear correlation with viable cell numbers, enabling accurate quantification from minute sample volumes
3. Streamlined Workflow
Simple add-incubate-read protocol compatible with high-throughput screening, significantly improving experimental efficiency
4. Robust and Reproducible Data
Provides standardized, reproducible quantitative data for organoid-based drug sensitivity testing
IV. Research Significance and Clinical Translation
This study provides the first demonstration in the eCCA subtype that:
• CAFs drive tumor progression and gemcitabine resistance through the HGF/c-MET signaling axis
• c-MET inhibitors combined with gemcitabine represent a highly promising therapeutic strategy
• The organoid-PDX platform efficiently predicts clinical drug efficacy, advancing precision therapeutics
Absin delivers high-performance reagents that empower tumor microenvironment and drug resistance mechanism research, providing robust support for clinical translation in cholangiocarcinoma and other malignancies.
Contact Absin
Absin provides antibodies, proteins, ELISA kits, cell culture, detection kits, and other research reagents. If you have any product needs, please contact us.
| Absin Bioscience Inc. worldwide@absin.cn |
 Follow us on Facebook: Absin Bio Follow us on Facebook: Absin Bio |