- Cart 0
- English
Albison panoramic multi-labeled tissue microenvironment staining analysis
High-end 7-10 color experimental services
Precise imaging, comprehensive analysis, and deep exploration of the microscopic world of cells
Distance distribution of immune cells in the microenvironment around the tumor area
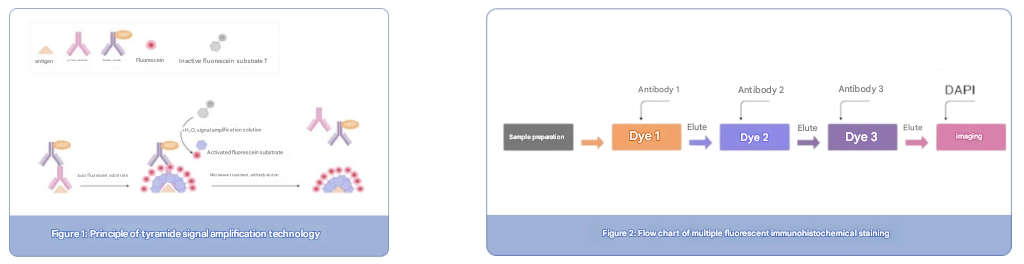
Experimental principle: TSA tyramide signaling method technology was carried out on paraffin-embedded thyroid cancer tissue sections, using HRP-labeled secondary antibody, HRP catalyzed fluorescein substrate added to the system, and activated fluorescent substrate was generated, which could be covalently bound to tyrosine on the antigen to make the sample stably covalently bound to fluorescein. The non-covalently conjugated antibody is then washed away with thermal repair to avoid cross-reactivity, and so on to achieve multiplexed fluorescent labeling.
High-end service: After 6-9 biomarkers were labeled simultaneously using Absin multiplex TSA staining technology, continuous full-spectrum high-magnification imaging was performed using the TissueFAXS Spectra system to construct panoramic (multispectral) virtual slides. Obtain clear multi-color sample images and independent signals of each single channel, and depict the complex tumor immune microenvironment from a multi-target perspective.
Service Process:

Multicolor labeling of the tumor immune microenvironment in situ of organisms → Acquisition of super-large panoramic continuous full-spectrum images → Continuous spectral resolution/removal of background autofluorescence/removal of blood cell autofluorescence → Tissue in situ flow cytometry analysis/forward and reverse backtracking data verification mechanism

Data delivery: For projects with 8 colors and above, the original scan of the whole film (200X original image) will be delivered with a free hard disk, and the data security is guaranteed.
Free analysis: Immunocell typing screening and single-target quantification of samples. (Single-cell analysis: provide data analysis such as cell number, percentage, light intensity, area, etc., including tissue flow cytometry scatter plots)
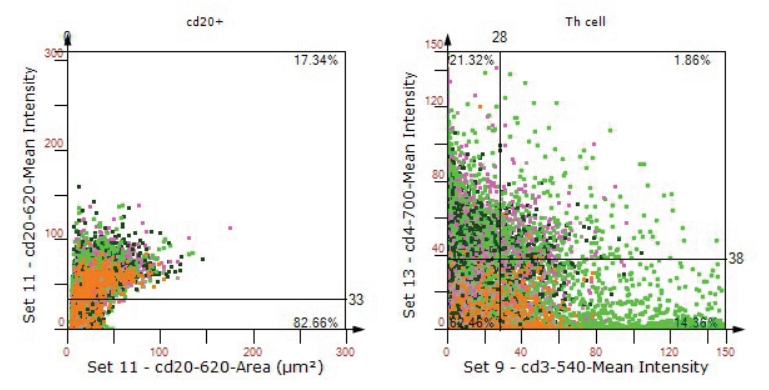
The figure on the left shows the analysis of CD20+-positive cell populations using a unique tissue flow cytometry scatterplot, and the figure on the right shows the co-standard analysis of CD4 and CD3
Other Services:
High-end analysis services: 4 Yang and above, AI recognition, spatial distance analysis, etc., increase the cost of building templates to meet more research needs.
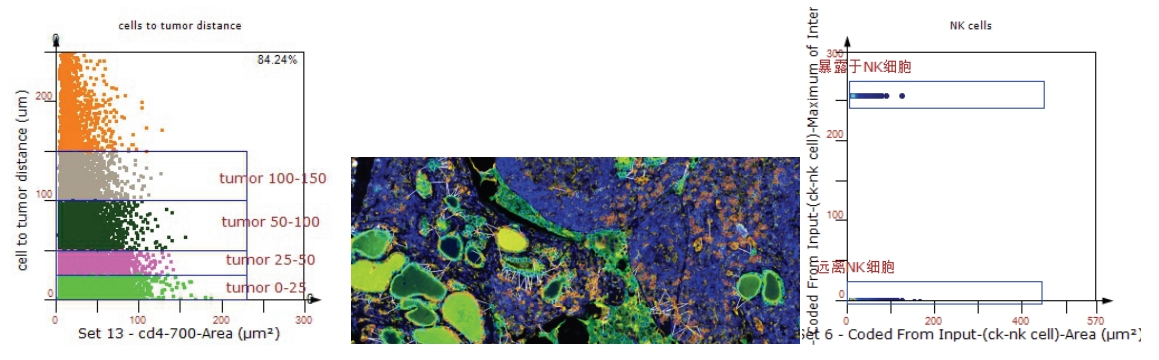
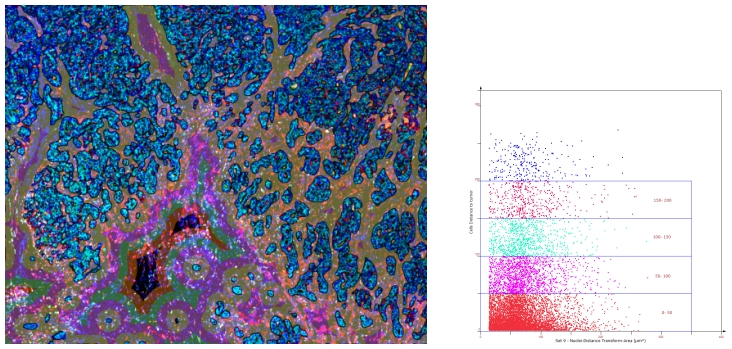
Spatial analysis: Single-cell quantitative analysis of the spatial distribution of immune cells in the microenvironment with micron-level precision centered on the tumor region, and different colors represent different distance ranges from the tumor. The number of dots in different colors in the scatter plot on the left represents the number of immune cells infiltrated at different distances from the tumor, and the distance relationship between tumor cells and NK cells is analyzed in the right figure, and the NK cells within 30 ranges around the tumor cells are counted, and the histogram is displayed as a line schematic graph.
Extra-large slide scanning: TG supports ultra-large slide scanning to meet the needs of different sample sizes.
High-resolution oil scanning: Provide high-resolution oil scan service to make the details clearer.
Absin provides antibodies, proteins, ELISA kits, cell culture, detection kits, and other research reagents. If you have any product needs, please contact us.
|
Absin Bioscience Inc. Email: worldwide@absin.net |
 Follow us on Facebook: Absin Bio Follow us on Facebook: Absin Bio |
July 11, 2025
Clicks:123