- Cart 0
- English
Flow cytometry starts from scratch
July 04, 2025
Clicks:850
Flow cytometry is a technology that uses flow cytometer to carry out one-by-one, multi-parameter, rapid qualitative and quantitative analysis or sorting of single column cells or biological particles in a fast linear flow state, which has the characteristics of fast detection speed, multiple measurement parameters, large amount of collected data, comprehensive analysis information, high sorting purity, flexible methods, etc., and can be used for cell size, cell granularity, DNA and RNA content, protein content, Detection of cell-specific antigens, cell viability, intracellular pH value, cell cycle, apoptosis, cell function analysis, etc.
Apoptosis analysis by flow cytometry
abs50001 Annexin V-FITC/PI Apoptosis Assay Kit
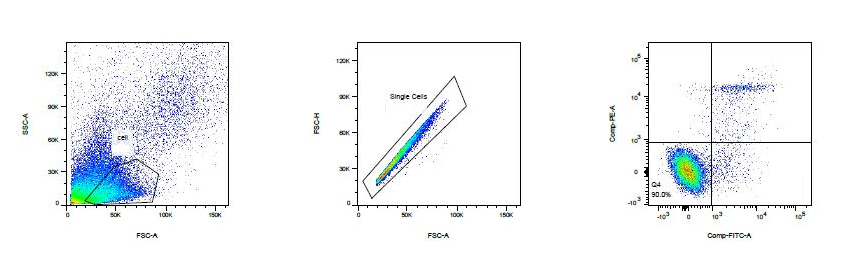
Flow cytometric analysis of FITC Annexin V staining. Human PBMCs are treated with 12 uM camptothecin for 4 h. Cells are incubated with FITC Annexin V in buffer containing propidium iodide (PI) and analyzed by flow cytometry. After 2 hours of treatment, there were three main groups of cells: viable cells (FITC Annexin V and PI negative) and early apoptosis (FITC Annexin V positive and PI negative) and FITC Annexin V and PI double positive cells.
Fundamentals of flow cytometry
To understand the basic principles of flow cytometry, it is necessary to understand flow cytometry, which consists of three parts: liquid system, optical path system and electronic system.
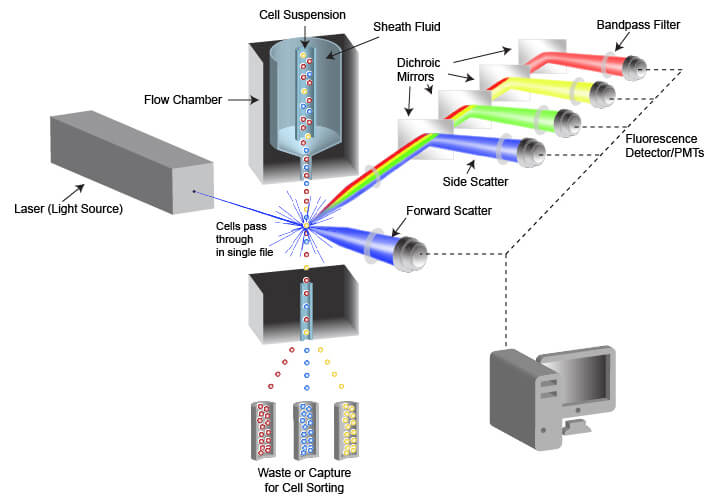
Fluid system: ensures that cells pass through in a single arrangement, one cell at a time;
Optical path system: generate, collect, separate, and convert optical signals to provide the basis for subsequent data analysis;
Electronic systems: Process and save signals detected by optical systems and convert these signals into digital data that can be used for analysis.
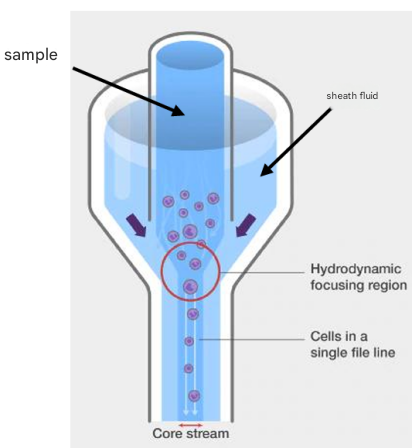
Hydraulic system
The function of the liquid system is to arrange the sample into a single column of cells/particles stream, and make the cells/particles pass through the detection point of the flow cytometer at a stable and high speed, mainly including flow chamber + sheath fluid + waste liquid + sample loader + pressure control system
● The higher the loading speed, the coarser the sample core, the worse the laser focus, and the lower the resolution.
● Qualitative measurements generally do not require high flow rate, such as immunophenotyping;
● Quantitative measurements require low speeds, such as cell cycle assays.
Light signal in flow cytometry
1. Scattered light signal
Scattered light signal is an intrinsic parameter of the cell and does not require the use of fluorescent labels;
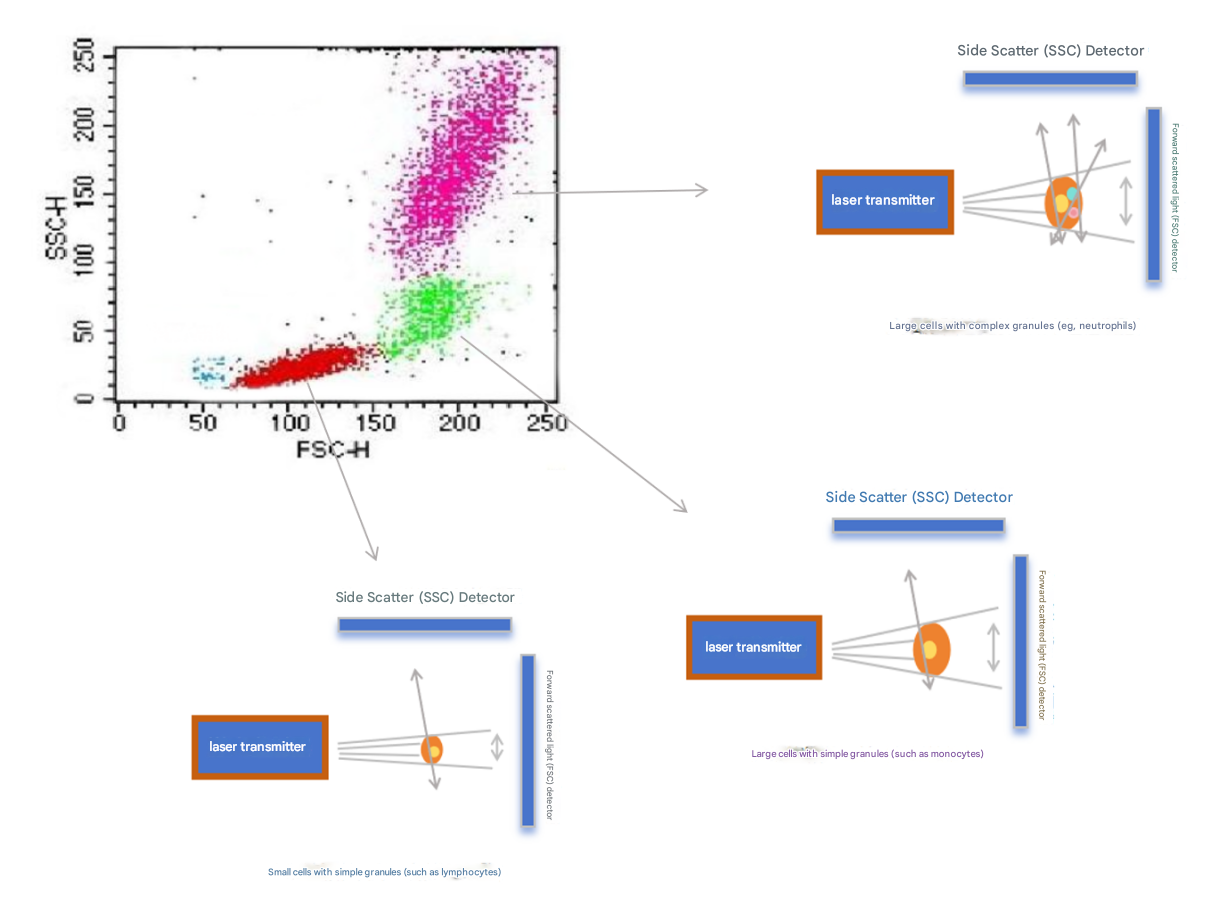
● Forward scatter: The strength of the FSC signal is related to the size of the cell;
● Side scatter: The strength of the SSC signal is correlated with the number of particles in the cell;
● The function of FSC-SSC: use cell size and granularity to preliminarily distinguish cell populations, remove cell debris, and remove adherent cells.
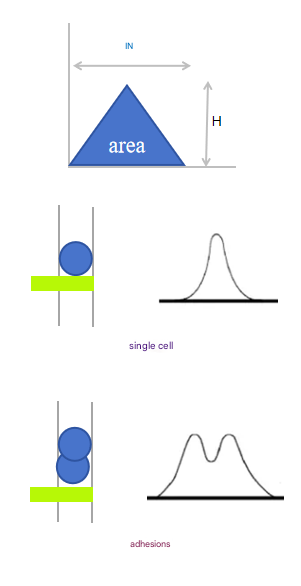
From the time the cell enters the laser irradiation zone to the time it leaves, an electrical impulse signal is generated. H is the pulse height, which represents the peak of the pulse signal; W is the pulse width, which refers to the time it takes for the cell to pass through the area irradiated by the laser; A is the area of the pulsed signal.
In practice, some cells will stick to each other and pass through the laser irradiation area continuously, which is recognized as a primary signal by the instrument, which interferes with our final data analysis. When the measured height of the adhesion remains the same, the width and area are doubled, that is, the FSC-Height remains the same, and the FSC-Area and Width increase.
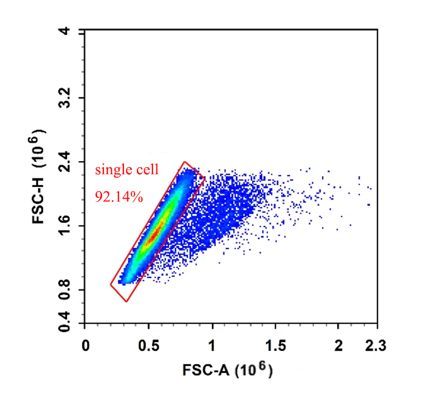
We can use FSC-A and FSC-H to exclude adhesions, when normal single cells pass through the flow cytometry laser irradiation area, H and A are proportional to increase, and when adhesions pass through, H remains unchanged and A increases, therefore, adhesions can be perfectly excluded by the FSC-A (Area) and FSC-H (Height) parameters of the cell, and FSC-H and FSC-W can also be operated by FSC-H and FSC-W, but this method is not suitable for complex samples (the size of various cells in the sample is quite different), In fact, an important step in removing adhesions is during the sample preparation phase.
2. Fluorescence signal
In flow cytometry, the fluorescence signal is generated due to a specific fluorescein molecule that takes up a certain wavelength of light and transitions to the excited state, which then releases photons (fluorescence) back to the ground state. Understanding the generation of fluorescent signals and the components of each component can help us match our multicolors.
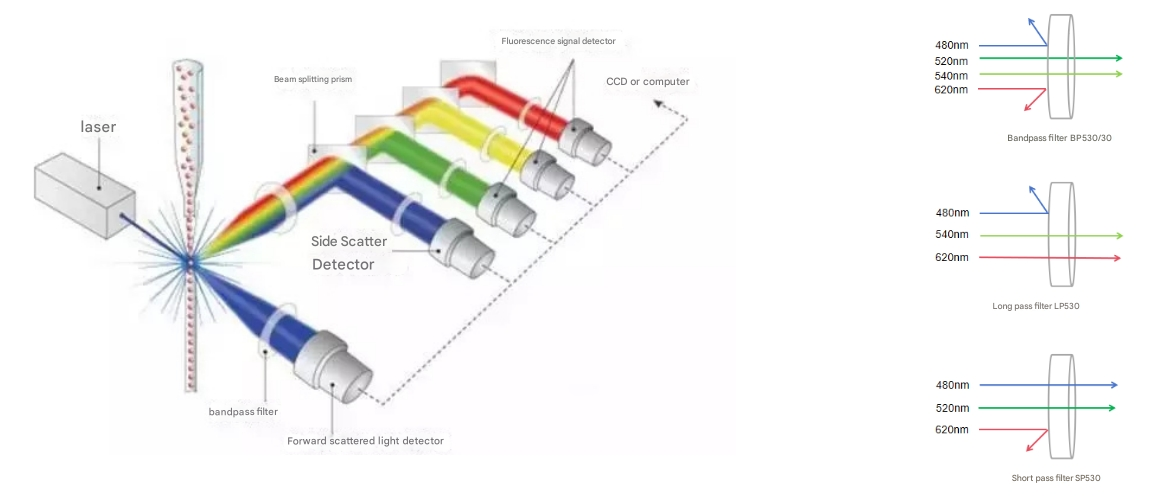
Laser: Provides a monochromatic beam to excite fluorescent markers in cells, common lasers are 355nm (ultraviolet), 405nm (violet), 488nm (blue), 561nm (yellow-green), 633nm (red). Some flow cytometers are only equipped with 488nm; Some flow cytometers are equipped with two types of lasers, such as 488 nm and 638 nm. Multicolor cytometry may require more lasers.
Filters: Usually include bandpass filters, long-pass filters, short-pass filters, and bandpass filters. Bandpass filters allow light to pass through a fixed range of wavelengths. For example, BP530/30 indicates that light in the wavelength range of 515nm-545nm is allowed to pass through, and light above a certain wavelength is allowed to pass through, and light below a specific wavelength cannot pass through. Short-pass filters allow light below a specific wavelength to pass through.
Beamsplitting prism: Separates the light emitted by the laser from the light emitted by cell scattering or fluorescence, ensuring that different colors of fluorescence can be accurately captured by different detectors.
Fluorescence Signal Detector: Detects the fluorescence signal separated by a beamsplitter prism. Each detector corresponds to a specific fluorescence wavelength and is used to measure the intensity of a specific fluorescent marker in the cell.
Electronic systems
It is mainly responsible for processing and digitizing optical signals detected by optical systems
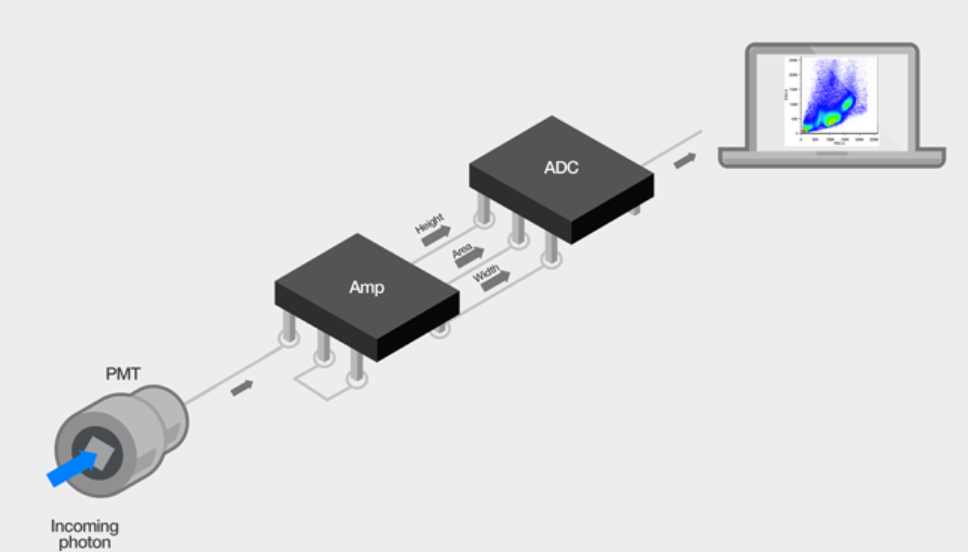
Amplification: As cells or particles pass through the detection point, the light signal (including forward scatter (FSC), side scatter (SSC), and fluorescence signals) generated by the laser beam hitting them is detected by a photomultiplier tube (PMT) or photodiode (PD) and converted into an electrical signal. These initial electrical signals are usually weak and need to be amplified by signal amplifiers.
Analog-to-digital conversion (ADC): The amplified electrical signal is converted into a digital signal by an analog-to-digital converter (ADC). The number of bits of the ADC (e.g., 14 to 24 bits) determines the resolution of the signal and the range of values that can be converted.
Pulse Processing: The voltage pulses of all parameters of each cell are binned, that is, the analog signal is converted into a digital signal according to a certain sampling rate and ADC resolution, and stored as data for subsequent analysis.
Data storage and analysis: Digital signals are sent to a computer and stored as data files for analysis. These data files are typically exported in standard flow cytometry file formats, such as FSC digital data files.
Recommended for streaming good things
|
Catalog number |
Product name |
specification |
|
Tissue dissociation solution |
10mL |
|
|
Mouse tumor tissue dissociation kit |
10T/25T |
|
|
Mouse liver tissue dissociation kit |
10T/25T |
|
|
Mouse lung tissue dissociation kit |
10T/25T |
|
|
Mouse intestinal tissue dissociation kit |
10T/25T |
|
|
Mouse heart tissue dissociation kit |
10T/25T |
|
|
Mouse kidney tissue dissociation kit |
10T/25T |
|
|
Mouse pancreatic tissue dissociation kit |
10T/25T |
|
|
Mouse spleen tissue dissociation kit |
10T/25T |
|
|
Mouse brain tissue dissociation kit |
10T/25T |
|
|
Tissue digestion kit |
1kit |
|
|
Red blood cell lysate (1×) |
100mL/500mL |
|
|
Human lymphocyte isolate |
200mL/200mL×10 |
|
|
Cell separation fluid |
100mL |
|
|
Tissue preservation solution |
100mL |
|
|
70um cell sieve (200 mesh, white, bottom filtered) |
1 box |
|
|
Stimulation Cocktail Kit,Without GolgiPlug |
100T |
|
|
Stimulation Cocktail Kit,With Brefeldin A |
100T |
|
|
Fixation/Permeabilization Kit |
100T |
|
|
Fixation/Permeabilization Kit,With Brefeldin A |
100T |
|
|
Sheath fluid |
20L |
|
|
Mouse Fc receptor blocker |
200T/500T |
|
|
Human Fc receptor blockers |
50T/200T |
|
|
Phoboester |
1mg/5mg/25mg |
|
|
Ionomycin calcium salt |
1mg/5mg |
|
|
D-PBS buffer (1 ×, no calcium magnesium) |
500mL |
|
|
Brefeldin A |
10mg/25mg/50mg |
|
|
Monensin sodium salt |
25mg/100mg |
|
|
Cell staining buffer |
500mL |
|
|
fixer |
50mL |
|
|
For more related products, scan the code to query |
||
https://www.absin.cn/tosoles/flow-cytometry.html
|
dye |
Maximum excitation light |
Maximum emitted light |
|
MF450 |
405 nm |
450 nm |
|
BZY405 |
405 nm |
455 nm |
|
Pacific Blue |
405 nm |
455 nm |
|
BZY500 |
405 nm |
500 nm |
|
BZY515 |
405 nm |
525 nm |
|
MF500 |
405 nm |
525 nm |
|
MF510 |
405 nm |
525 nm |
|
MF540 |
405 nm |
525 nm |
|
AF488 |
490 nm |
525 nm |
|
FITC |
494 nm |
520 nm |
|
PE |
496 nm, 565 nm |
578 nm |
|
PE-CF 594 |
488 nm |
610 nm |
|
PerCP |
482 nm |
678 nm |
|
PerCP-Cy5.5 |
482 nm |
690 nm |
|
PE-Cy5.5 |
496 nm, 565 nm |
690 nm |
|
PE-Cy7 |
496 nm, 565 nm |
782 nm |
|
AF555 |
555 nm |
572 nm |
|
PE |
496 nm, 565 nm |
578 nm |
|
AF594 |
590 nm |
617 nm |
|
PE-Cy5 |
565 nm |
667 nm |
|
PE-Cy5.5 |
496 nm, 565 nm |
690 nm |
|
PE-Cy7 |
496 nm, 565 nm |
782 nm |
|
APC |
650 nm |
660 nm |
|
AF647 |
650 nm |
665 nm |
|
Cy5 |
650 nm |
670 nm |
|
APC-Cy5.5 |
651 nm |
700 nm |
|
APC-AF700 |
640 nm |
712 nm |
|
AF700 |
695 nm |
720 nm |
|
APC-Cy7 |
650 nm |
767 nm |
Absin provides antibodies, proteins, ELISA kits, cell culture, detection kits, and other research reagents. If you have any product needs, please contact us.
|
Absin Bioscience Inc. Email: worldwide@absin.cn |
 Follow us on Facebook: Absin Bio Follow us on Facebook: Absin Bio |