- Cart 0
- English
Experimental Guide for Evaluating Cellular Oxidative Stress Status
March 11, 2025
Clicks:1022
I. What is Oxidative Stress?
During the metabolic processes of an organism, reactive oxygen species (ROS) are continuously generated through both non-enzymatic and enzymatic reactions. Approximately 1%-3% of the inhaled oxygen is converted into superoxide anion (O2−·) and its reactive derivatives. However, under the synergistic action of antioxidant enzymes and exogenous and endogenous antioxidants, these ROS are constantly cleared. Under physiological conditions, the generation and clearance of ROS are in dynamic equilibrium, maintaining ROS at an extremely low, harmless level. When endogenous and/or exogenous stimuli cause abnormal metabolism and a sudden increase in ROS production, or when there is a deficiency in antioxidant substances, or when the balance between oxidants and antioxidants is disrupted, the organism enters a state of oxidative stress. When cells are in a state of oxidative stress, they can oxidatively damage biomolecules, leading to cell death and tissue damage, which are associated with many pathological processes[1].
Table 1 Common Oxidants In Vivo
| Type of Oxidant | Main Free Radicals |
| Reactive Oxygen Species (ROS) | Superoxide anions (O2·− or HO2·) and hydroxyl radicals (·OH), along with their reactive derivatives such as hydrogen peroxide (H2O2), singlet oxygen (1O2), and lipid peroxides like IO·, LOO·, and IOOH. |
| Reactive Nitrogen Species (RNS) | NO and the series of nitrogen-containing compounds formed by the reaction of NO with O2, NO with O2-. |
II. Methods for Evaluating Oxidative Stress
The concentration of free radicals can be measured using electron spin resonance, chemiluminescence, and chemical trapping methods. However, due to their high reactivity, short lifespan, and extremely low concentration, direct measurement of free radicals is very inconvenient. Free radicals primarily oxidatively damage DNA, lipids, and proteins. Detecting oxidative stress metabolites in tissues and biological fluids is particularly important for evaluating oxidative stress.
In the body, almost all ROS should be promptly cleared, except for a very small amount utilized by the organism. Excessive production of specific ROS triggers the generation of corresponding antioxidant substances to eliminate the excess ROS. The defense system against ROS-induced damage in the body mainly includes antioxidant enzymes, antioxidants, and proteins that sequester transition metals, all of which can specifically limit oxidative damage in the body.
1. Oxidation Products of DNA
The main ROS causing DNA oxidative damage is the hydroxyl radical (·OH). The ·OH can attack deoxyribose, leading to the cleavage of deoxyribose and the breaking of phosphodiester bonds, causing single-strand or double-strand breaks in DNA. Additionally, the ·OH can add to the π-bond of DNA bases, generating specific purine and pyrimidine base modifications. The damaged DNA can be repaired by nucleases and glycosylases, releasing deoxyribonucleotides and free bases. For example, guanine (G) is oxidized to form 8-oxo-G, which is excised in the form of 8-OHdG by repair enzymes and excreted in urine. The presence of 8-OHdG in urine reflects the amount of "whole-body" DNA damage repaired through excision repair, making 8-OHdG a marker of DNA oxidative damage caused by endogenous reactive oxygen species. In addition, the Comet Assay Kit (abs60590-75T) can be used to detect DNA strand breaks caused by oxidative damage in white blood cells to evaluate the oxidative stress status of patients.
2. Lipid Peroxidation Products
The phospholipids in biological membranes are rich in polyunsaturated fatty acids (PUFA), which are highly susceptible to attack by free radicals and their reactive derivatives in the presence of O2, initiating lipid peroxidation chain reactions. During lipid peroxidation, LO·, LOO·, and other radicals can also induce chain initiation and propagation reactions. LOO· can further form cyclic peroxides and endoperoxide radicals through intramolecular double bond addition, eventually breaking down into various metabolites. For example, peroxidized lipids can produce many aldehydes through β-scission of the peroxy group, such as malondialdehyde and 4-hydroxynonenal. Measurement of malondialdehyde (abs580011-96T) and 4-hydroxynonenal in biological samples can reflect lipid peroxidation. It has been reported that 4-hydroxynonenal is a better indicator of oxidative stress in Alzheimer's disease patients than malondialdehyde[2].
3. Antioxidant Enzymes
The main antioxidant enzymes in the antioxidant defense system include superoxide dismutase (SOD), catalase (Cat), and glutathione peroxidase (GSH-Px), which help clear free radicals and mitigate oxidative damage. In plasma, whole blood red blood cells, platelets, and tissues, there is a selenium-free GSH-Px, also known as glutathione S-transferase (GST), which catalyzes the conversion of ROOH to ROH, assisting GSH-Px in clearing ROOH in the body. Additionally, glutathione reductase (GSH-Re) can promote the regeneration of oxidized glutathione (GSSG) to reduced glutathione (GSH) by providing electrons from NADPH, thus playing an important role in the body's antioxidant function.
Various antioxidant enzymes assist in clearing ROS in the body from different perspectives and play different roles in the antioxidant process. Therefore, the levels and activities of SOD (abs580010-96T), Cat (abs580060-96T), GSH-Px (abs580136-96T), and GST (abs580046-96T) in the blood are often measured to reflect the body's antioxidant activity, with SOD and GSH-Px being the most emphasized.
4. Non-enzymatic Antioxidants
Non-enzymatic antioxidants are primarily low-molecular-weight substances that can scavenge free radicals, including glutathione, antioxidant vitamins (VitE, VitC), ubiquinol, metallothionein, and thioredoxin.
Glutathione (GSH) is a tripeptide compound (Glu-Cys-Gly) and the main non-protein thiol in aerobic organisms, with intracellular concentrations at the mM level. GSH is an antioxidant and a cofactor for several enzymes, such as GSH-Px, involved in various biological processes. It participates in the clearance of ·OH, HOCl, ONOO−, LO·, LOO·, O2−, and H2O2, protecting the body from oxidative stress-induced damage. The level of GSH (abs580006-96T) can reflect the body's antioxidant capacity to some extent. Coenzyme Q10 (CoQ10), an essential cofactor in the mitochondrial respiratory chain during oxidative phosphorylation, is reduced to ubiquinol (CoQ10H2) and can synergize with VitE (abs580153-96T) to terminate lipid peroxidation chain reactions, inhibiting the initiation and propagation of lipid peroxidation and preventing lipid peroxidation in plasma lipoproteins and biological membranes.
5. Total Antioxidant Capacity
Measuring the content of a single or several antioxidant components often fails to comprehensively reflect the antioxidant capacity of tissues and can be operationally difficult and cumbersome. Therefore, the total antioxidant capacity (TAC) in body fluids can be used to evaluate the overall antioxidant activity of the body, which is more effective than measuring each known antioxidant individually. The TAC value in plasma (abs580109-96T) reflects the amount of known and unknown antioxidants in body fluids and is considered a good indicator of oxidative stress. However, caution should be exercised when interpreting these test results, as increases in bilirubin or uric acid in diseases can mask the deficiency of other antioxidants. For example, in patients with renal failure, uric acid also has antioxidant properties, so TAC cannot reflect the true antioxidant capacity of patients with renal failure[3].
Many diseases are associated with oxidative stress, but it is not yet clear whether oxidative stress is a cause of disease or a result of the disease process. Currently, there is a lack of feasible methods to reflect the correlation between different oxidative stress states and disease processes. In disease research, it is best to use multiple detection methods simultaneously to obtain a clearer understanding of oxidative stress.
III. Application of Oxidative Stress Detection in Disease Research
On April 1, 2024, Professor Wan Jun's team from the Department of Cardiology at Renmin Hospital of Wuhan University published a research paper titled "IL-23p19 deficiency reduces M1 macrophage polarization and improves stress-induced cardiac remodeling by alleviating macrophage ferroptosis in mice" in the journal Biochemical Pharmacology. The study investigated whether IL-23p19 regulates cardiac remodeling and explored its possible mechanisms.
Researchers used transverse aortic constriction to establish a mouse model of cardiac remodeling, with sham surgery as a control. The results showed that IL-23p19 expression increased in the heart after surgery, likely primarily produced by cardiac macrophages. IL-23p19 knockout attenuated M1 macrophage polarization, reduced ferroptosis, improved cardiac remodeling in TAC mice, and alleviated cardiac dysfunction. In vitro cell culture experiments revealed that when phenylephrine was added, macrophages were the main cause of ferroptosis, and the ferroptosis inhibitor Ferrostatin-1 significantly inhibited M1 macrophage polarization by blocking ferroptosis. Fer-1 treatment also improved cardiac remodeling and alleviated cardiac dysfunction in IL-23p19 knockout mice undergoing TAC surgery. Finally, TAC IL-23p19 knockout mice that received macrophages isolated from WT mice exhibited increased M1 macrophage polarization and exacerbated cardiac remodeling, which were reversed when Fer-1 was administered. IL-23p19 knockout may attenuate M1 macrophage polarization, thereby improving cardiac remodeling through reduced macrophage ferroptosis, making IL-23p19 a potential target for the prevention and treatment of cardiac remodeling.
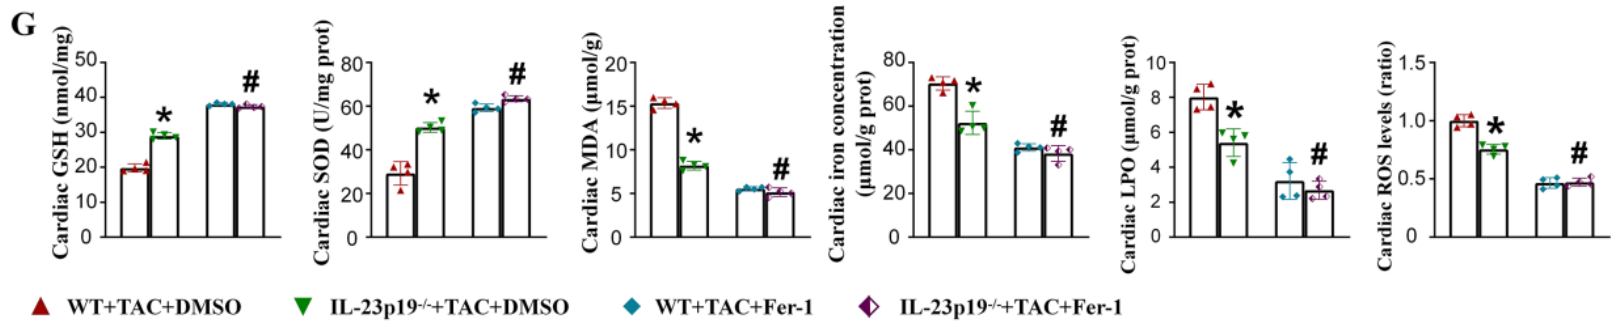
Figure 1: Measurement of GSH and MDA levels in rat serum using GSH Assay Kit (abs580006-96T) and MDA Assay Kit (abs580011-96T), combined with levels of SOD, LPO, ROS, and tissue iron content to assess the degree of cellular oxidative stress[4].
Introduction to the Use of the Malondialdehyde Assay Kit
I. Kit Components
|
Component |
Specification |
Storage Conditions |
|
96-Well Microplate |
1 plate |
— |
|
Assay Buffer |
30mL × 4 |
4 ℃ |
|
Reaction Buffer I |
10mL × 1 |
4 ℃ |
|
Reaction Buffer II |
1mL × 1 |
4 ℃ |
|
Dye Reagent A |
Powder × 1 |
4 ℃ |
|
Dye Reagent B |
5mL × 1 |
4 ℃ |
|
Standard (1 mmol/L) |
1mL × 1 |
4 ℃ |
|
Plate Adhesive Strips |
3 Strips |
— |
|
Technical Manual |
1 Manual |
— |
II. Operating Procedures
1. Preparation of Materials and Reagents
Materials to be prepared: Microplate reader (capable of reading absorbance at 532 nm), distilled water, pipettes and tips, mortar, centrifuge, timer, crushed ice, etc.
Dye Reagent A: Add 5 mL distilled water before use, place in a water bath at 70°C, and dissolve completely before use;
Dye Reagent Working Solution: When Dye Reagent A has cooled, add 5 mL of Dye Reagent B and mix;
Standard: Prepare a 2-fold serial dilution using ethanol.
2. Sample Processing
1) Cell/Bacterial samples: Collect cells/bacteria (5×10⁶) into a centrifuge tube, remove the supernatant after centrifugation, add 1 mL Assay buffer, and sonicate (power 20%, sonicate for 3 s, pause for 10 s, repeat 30 times). Centrifuge at 4°C, 8000g for 10 min, and transfer the supernatant to a new centrifuge tube. Store on crushed ice for subsequent detection.
2) Tissue samples: Weigh 0.1 g of tissue, homogenize in 1 mL Assay buffer on crushed ice, centrifuge at 4°C, 8000g for 10 min, and transfer the supernatant to a new centrifuge tube. Store on crushed ice for subsequent detection.
3) Serum/Plasma samples: Directly detectable.
3. Loading and Detection
Add reagents in the order shown in the table below (Note: Do not mix reagents together):
|
Reagent |
Standard Well |
Sample Well |
Control Well |
|
Standard |
10μL |
- |
- |
|
Sample |
- |
10μL |
- |
|
Assay Buffer |
- |
- |
10μL |
|
Reaction Buffer I |
100μL |
100μL |
100μL |
|
Mix |
|||
|
Reaction Buffer II |
10μL |
10μL |
10μL |
|
Dye Reagent Working Solution |
100μL |
100μL |
100μL |
|
Mix thoroughly, place in an oven at 90°C for 30 min, cool to room temperature, and measure the absorbance at 532 nm. |
|||
Note:1) For standards, a 2-fold serial dilution can be performed to create a standard curve;
2) For unknown samples, we recommend conducting a preliminary experiment with several samples to determine the sample concentration and dilution factor.
4. Standard Curve
The standard curve is for reference only; a new standard curve must be generated for each experiment.
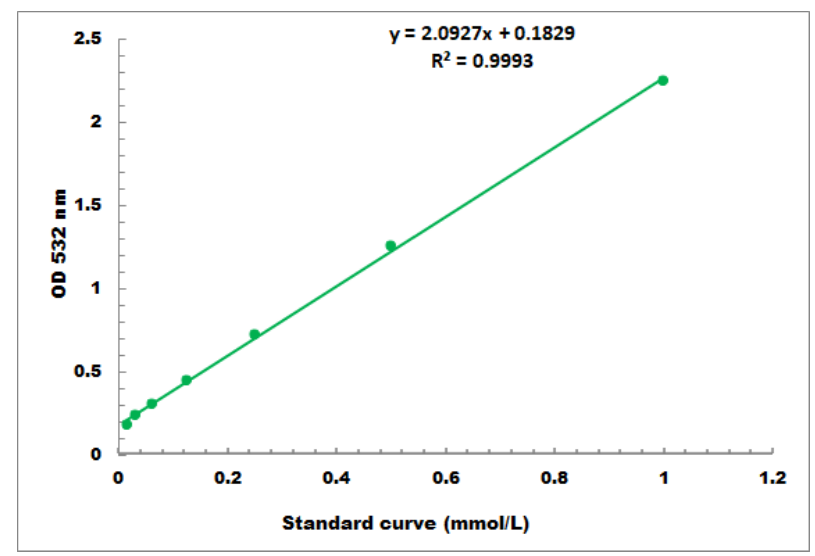
Detection range: 0.01 mmol/L - 1 mmol/L
Frequently Asked Questions
Q1: There is only one 96-Well Microplate in the kit, which is insufficient for the experiment. What should I do?
A1: The 96-well plate in the kit is provided for free. For subsequent experiments, a conventional 96-well microplate can be used as a substitute.
Q2: The kit's instruction manual includes both the standard curve method and the formula method. Which calculation method should I choose?
A2: Either method is acceptable. The formula is a simplified calculation. It is recommended to use the standard curve for more accurate results. Note that when using the standard curve method, a new standard curve must be generated for each experiment.
Q3: If the kit cannot be used up at once, how long can it be stored?
A3: The dye in the kit is prone to oxidation and deterioration after dissolution. It should be prepared and used immediately. Long-term storage may affect the colorimetric readings and thus the detection results. If samples need to be tested in batches, it is recommended to collect and store samples in batches, and perform unified detection once all samples are collected. Additionally, if the components are insufficient due to prolonged storage or other reasons, individual components of the kit can be purchased separately from our company.
References
[1] Wang Qiulin, Wang Haoyi, Wang Shuren. Evaluation of oxidative stress state [J]. Chinese Journal of Pathophysiology, 2005, 21(10): 2069-2074.
[2] McGrath IT, McGleenon BM, Brennan S, et al. Increased oxidative stress in Alzheimer's disease as assessed with 4-hydroxynonenal but not malondialdehyde [J]. Quarterly Journal of Medicine, 2001, 94(9): 485-490.
[3] Bergesio F, Monzani G, Ciuti R, et al. Total antioxidant capacity (TAC): Is it an effective method to evaluate oxidative stress in uraemia? [J]. J Biolumin Chemilumin, 1998, 13(5): 315-319.
[4] Lu X, Ji Q, Pan H, et al. IL-23p19 deficiency reduces M1 macrophage polarization and improves stress-induced cardiac remodeling by alleviating macrophage ferroptosis in mice. Biochem Pharmacol. 2024, 222: 116072. doi:10.1016/j.bcp.2024.116072.
Recommended Oxidative Stress-Related Products:
|
Detection Item |
Catalog Number |
Product Name |
Detection Method/Range |
|
Lipid Peroxidation Products |
Malondialdehyde (MDA) Assay Kit |
Colorimetric; 0.01 mmol/L - 1 mmol/L |
|
|
Glutathione Peroxidase |
Glutathione Peroxidase Assay Kit |
Colorimetric; 0.01 mmol/L - 5 mmol/L |
|
|
Glutathione Reductase |
Glutathione Reductase Assay Kit |
Colorimetric; 4 umol/L - 400 umol/L |
|
|
Glutathione S-Transferase (GST) |
Glutathione S-Transferase (GST) Assay Kit |
Colorimetric |
|
|
Non-Enzymatic Antioxidants |
Glutathione Assay Kit |
Colorimetric; 0.01 mmol/L - 0.5 mmol/L |
|
|
Vitamin E |
Vitamin E Assay Kit |
Colorimetric; 50 umol/L - 2000 umol/L |
|
|
Vitamin C |
Vitamin C Assay Kit |
Colorimetric; 0.02 mmol/L - 2 mmol/L |
|
|
Coenzyme Q10 |
Coenzyme Q10 Assay Kit |
Colorimetric; 0.1 mmol/L - 10 mmol/L |
|
|
Total Antioxidant Capacity (T-AOC) |
Total Antioxidant Capacity (T-AOC) Assay Kit |
Colorimetric; 0.04 mmol/L - 4 mmol/L |
|
|
Total ROS Detection |
Reactive Oxygen Species (ROS) Assay Kit (Green Fluorescence) |
Fluorescence Method |
|
|
Total ROS Detection |
Reactive Oxygen Species (ROS) Assay Kit (Red Fluorescence) |
Fluorescence Method |
Absin provides antibodies, proteins, ELISA kits, cell culture, detection kits, and other research reagents. If you have any product needs, please contact us.
|
Absin Bioscience Inc. |
 Follow us on Facebook: Absin Bio Follow us on Facebook: Absin Bio |